Century 21 People’s Choice Realty Inc., Brokerage
120 MATHESON BLVD E #103
MISSISSAUGA, Ontario
L4Z 1X1
Mississauga, Central Erin Mills, L5M 5S8
$1,749,900
Listed by SUTTON GROUP - SUMMIT REALTY INC..
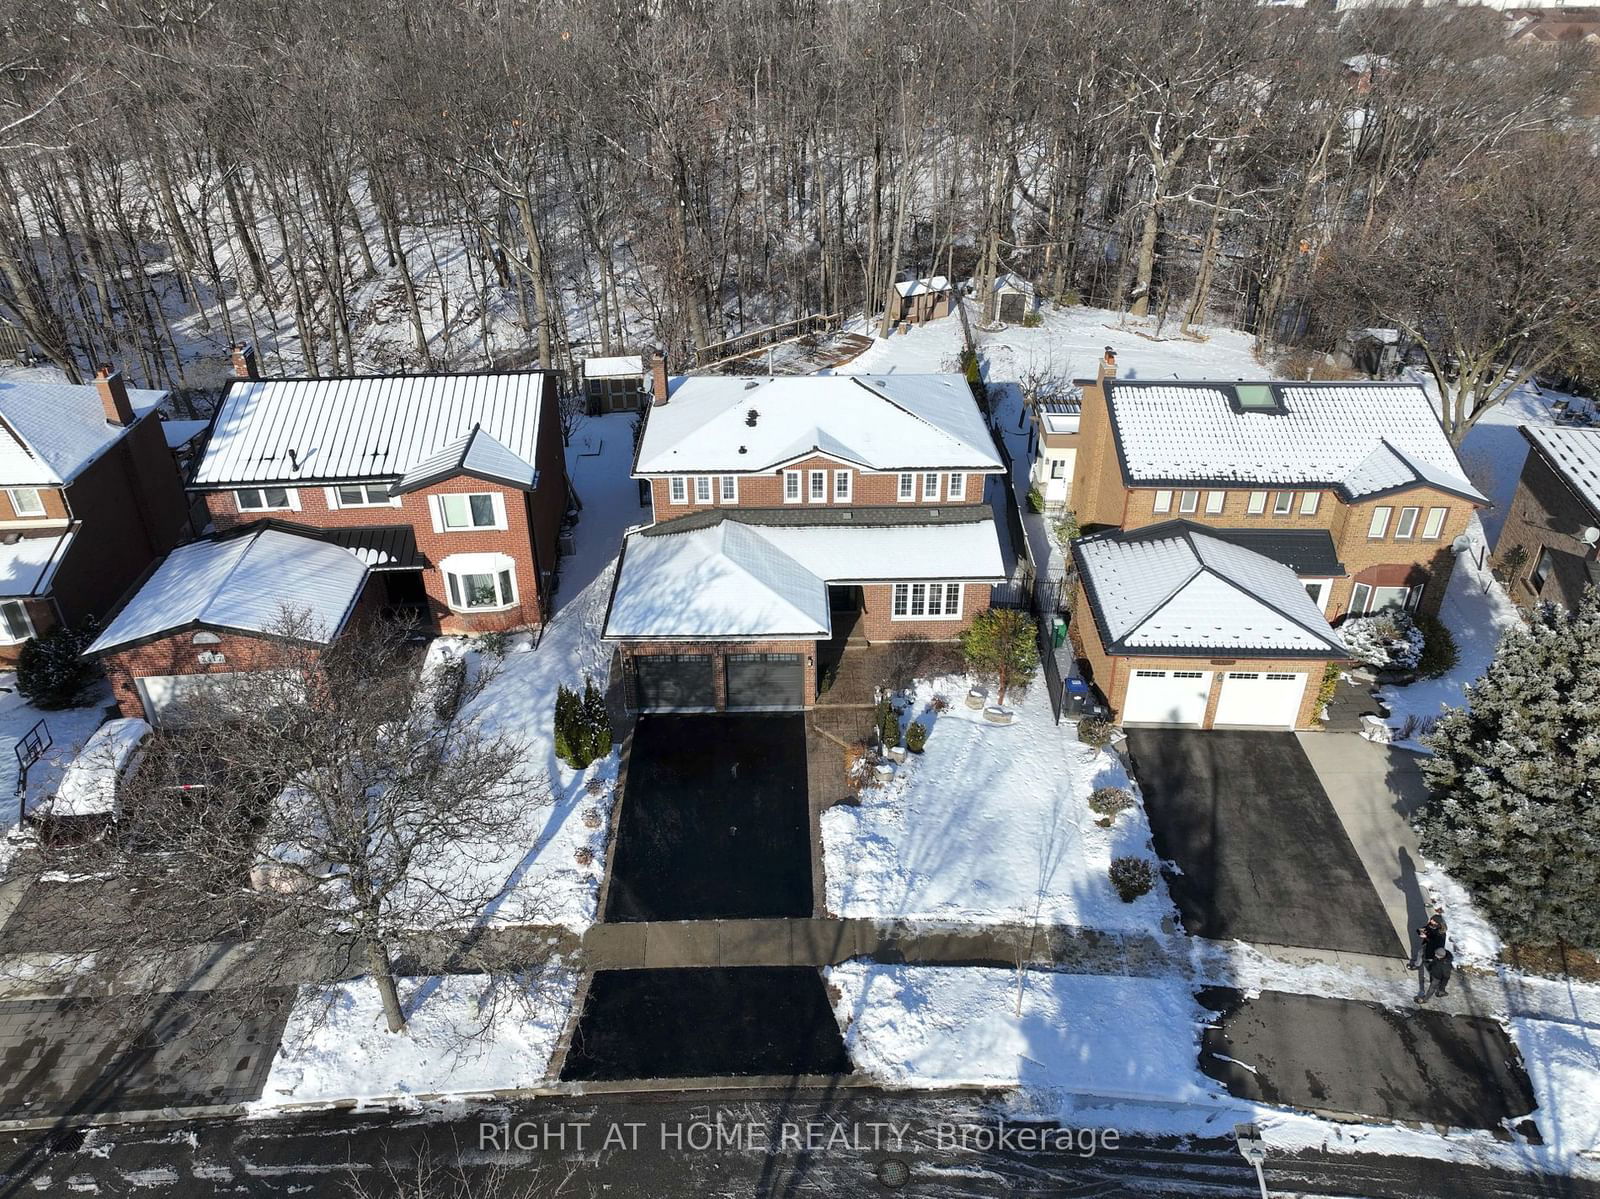
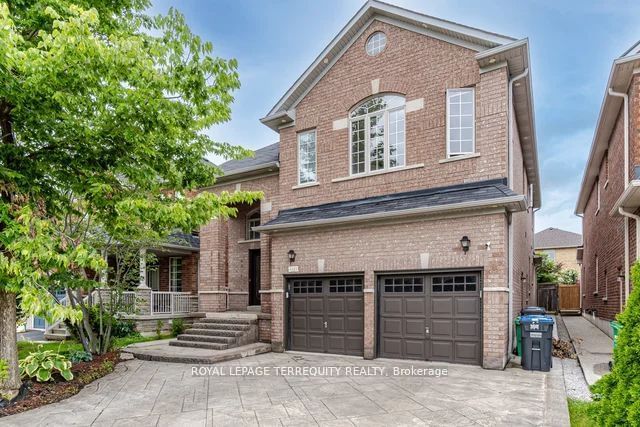
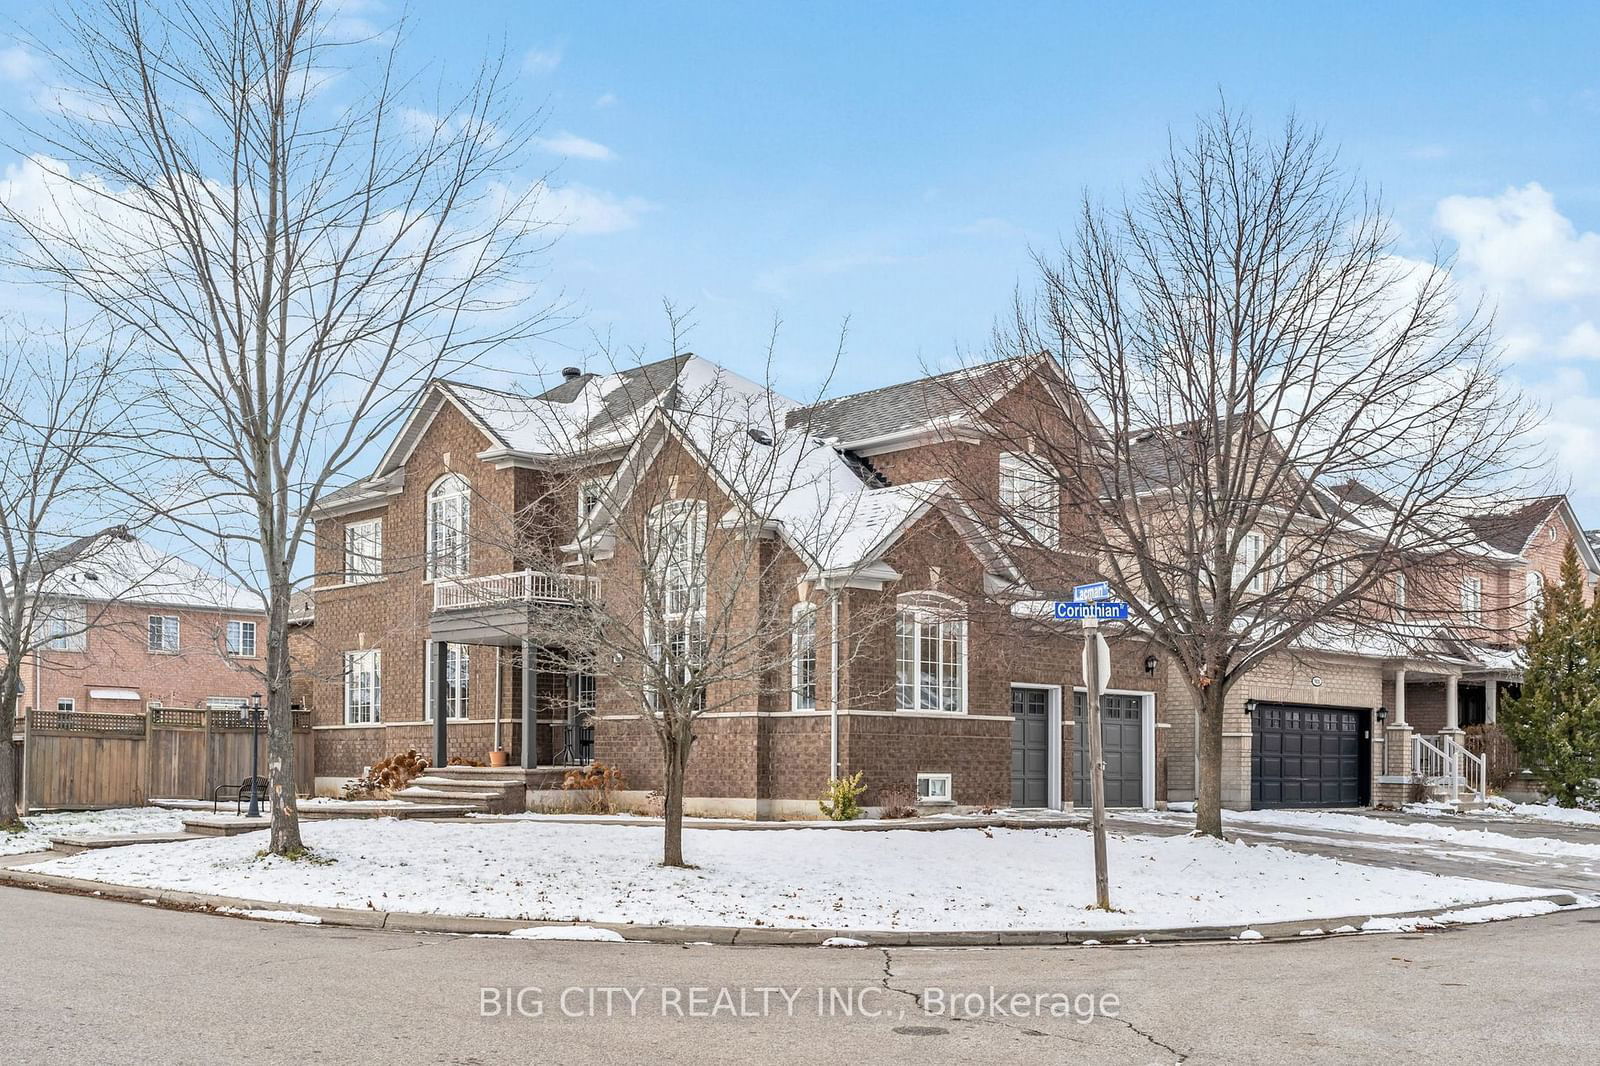
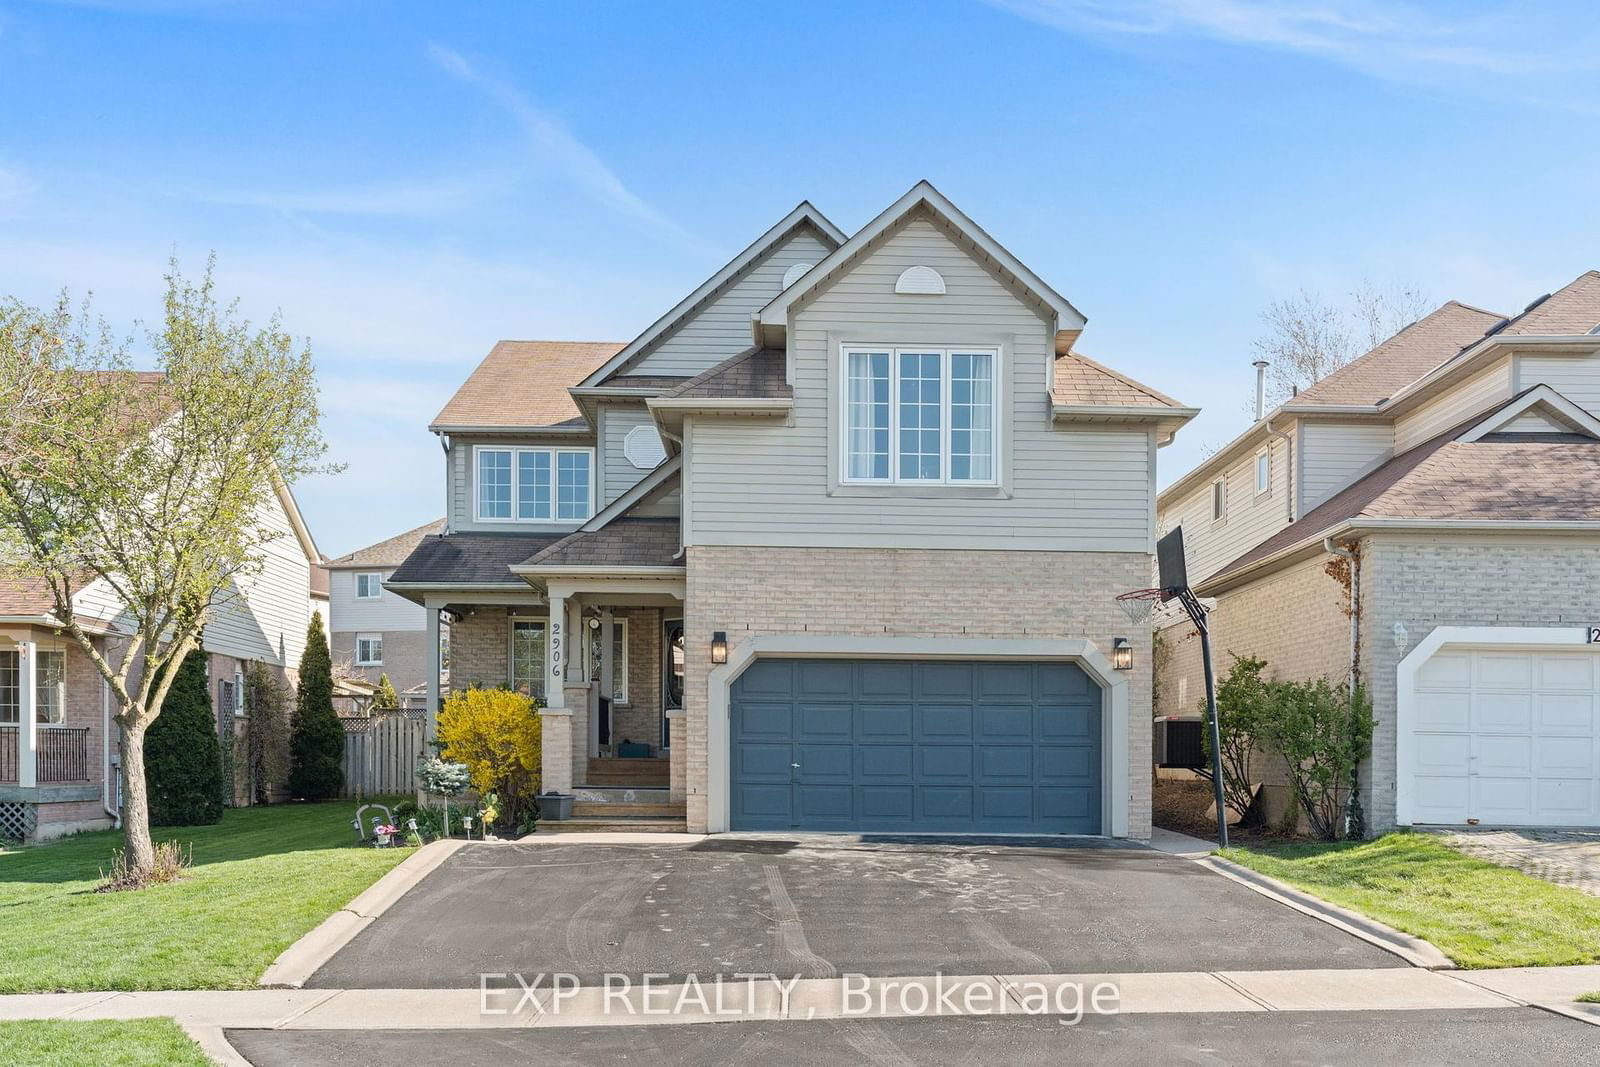
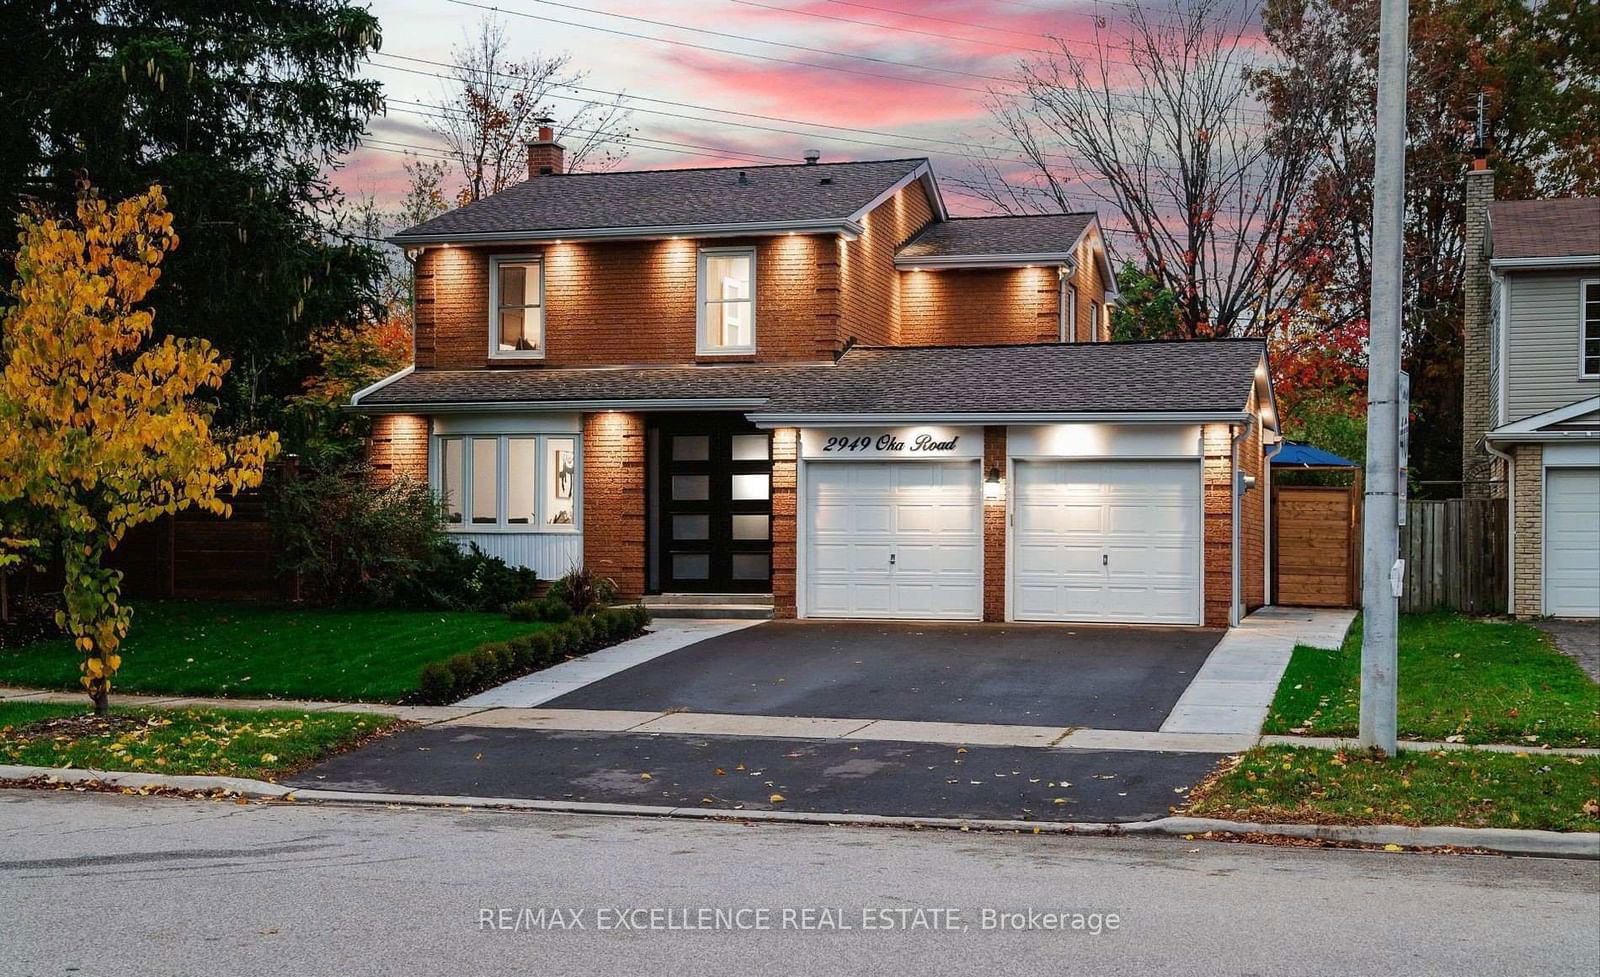
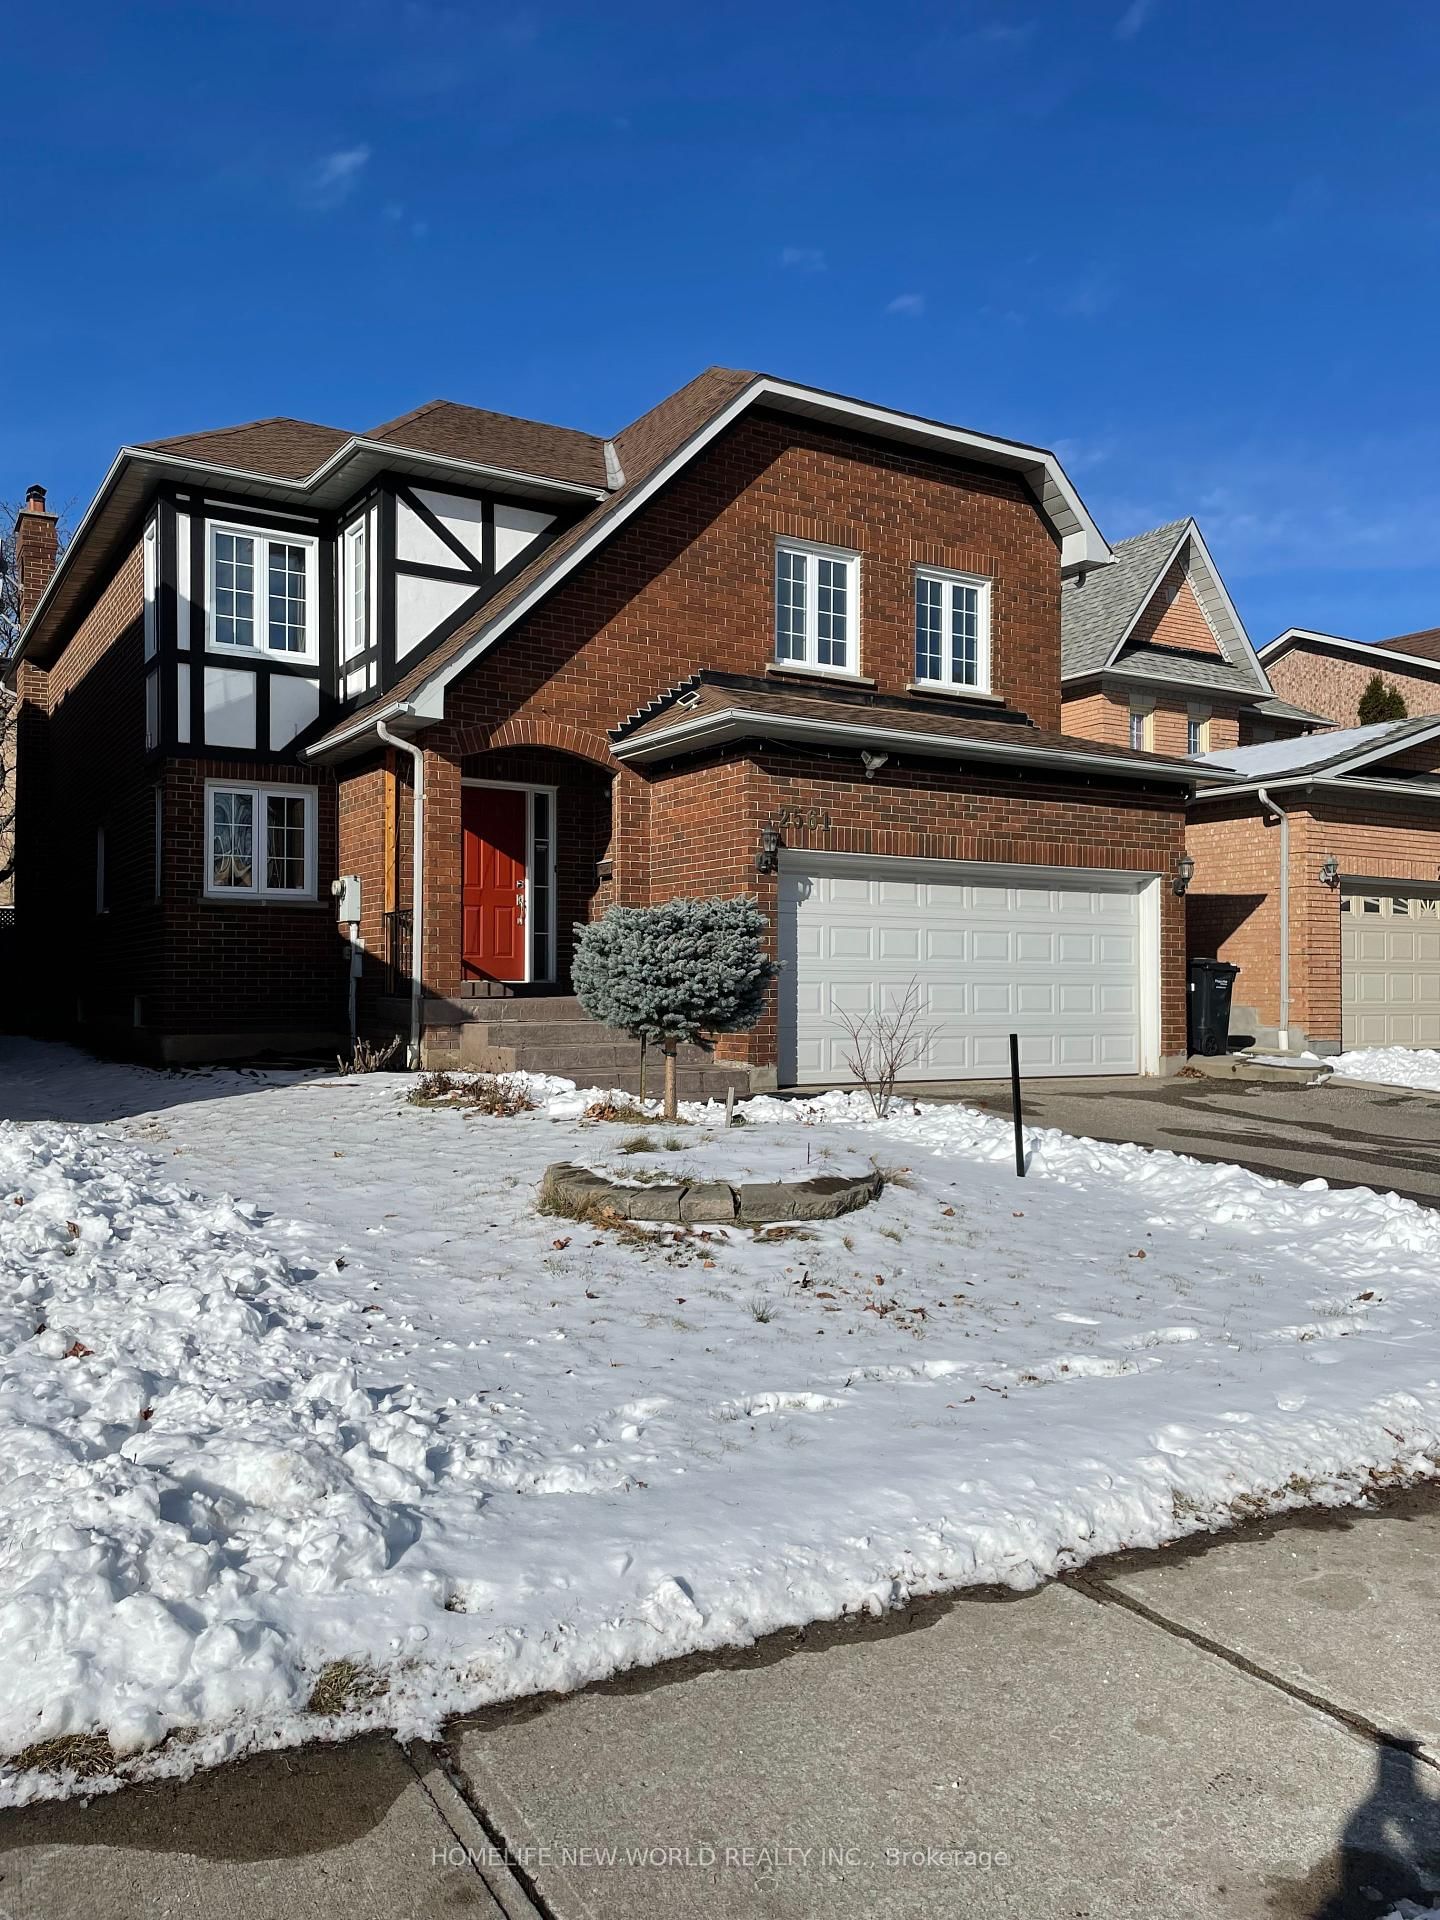
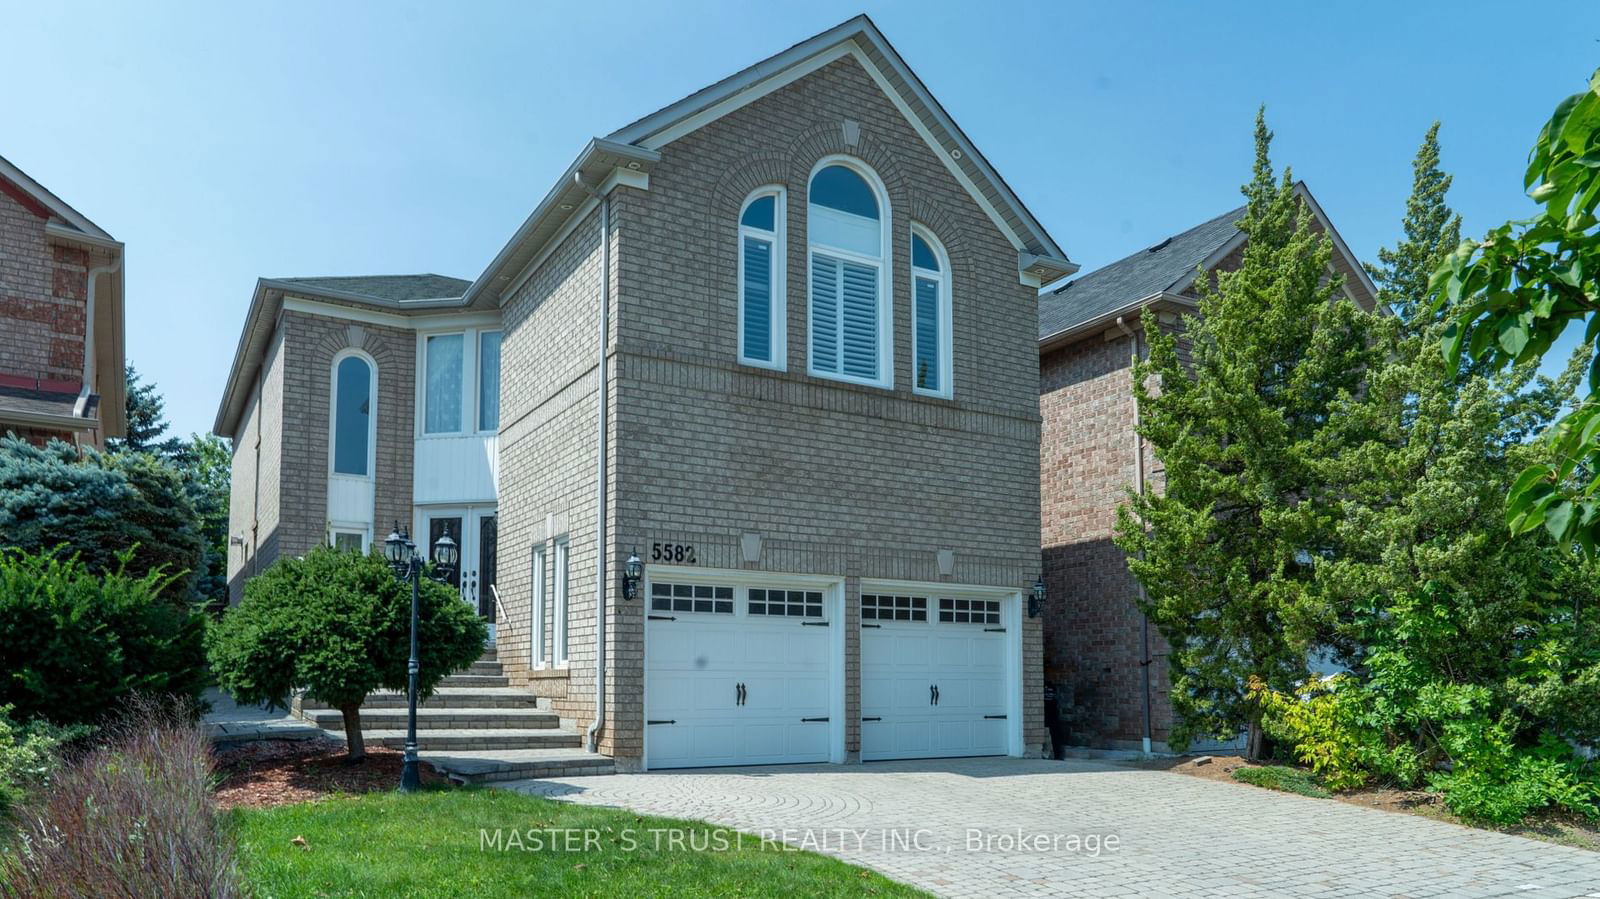
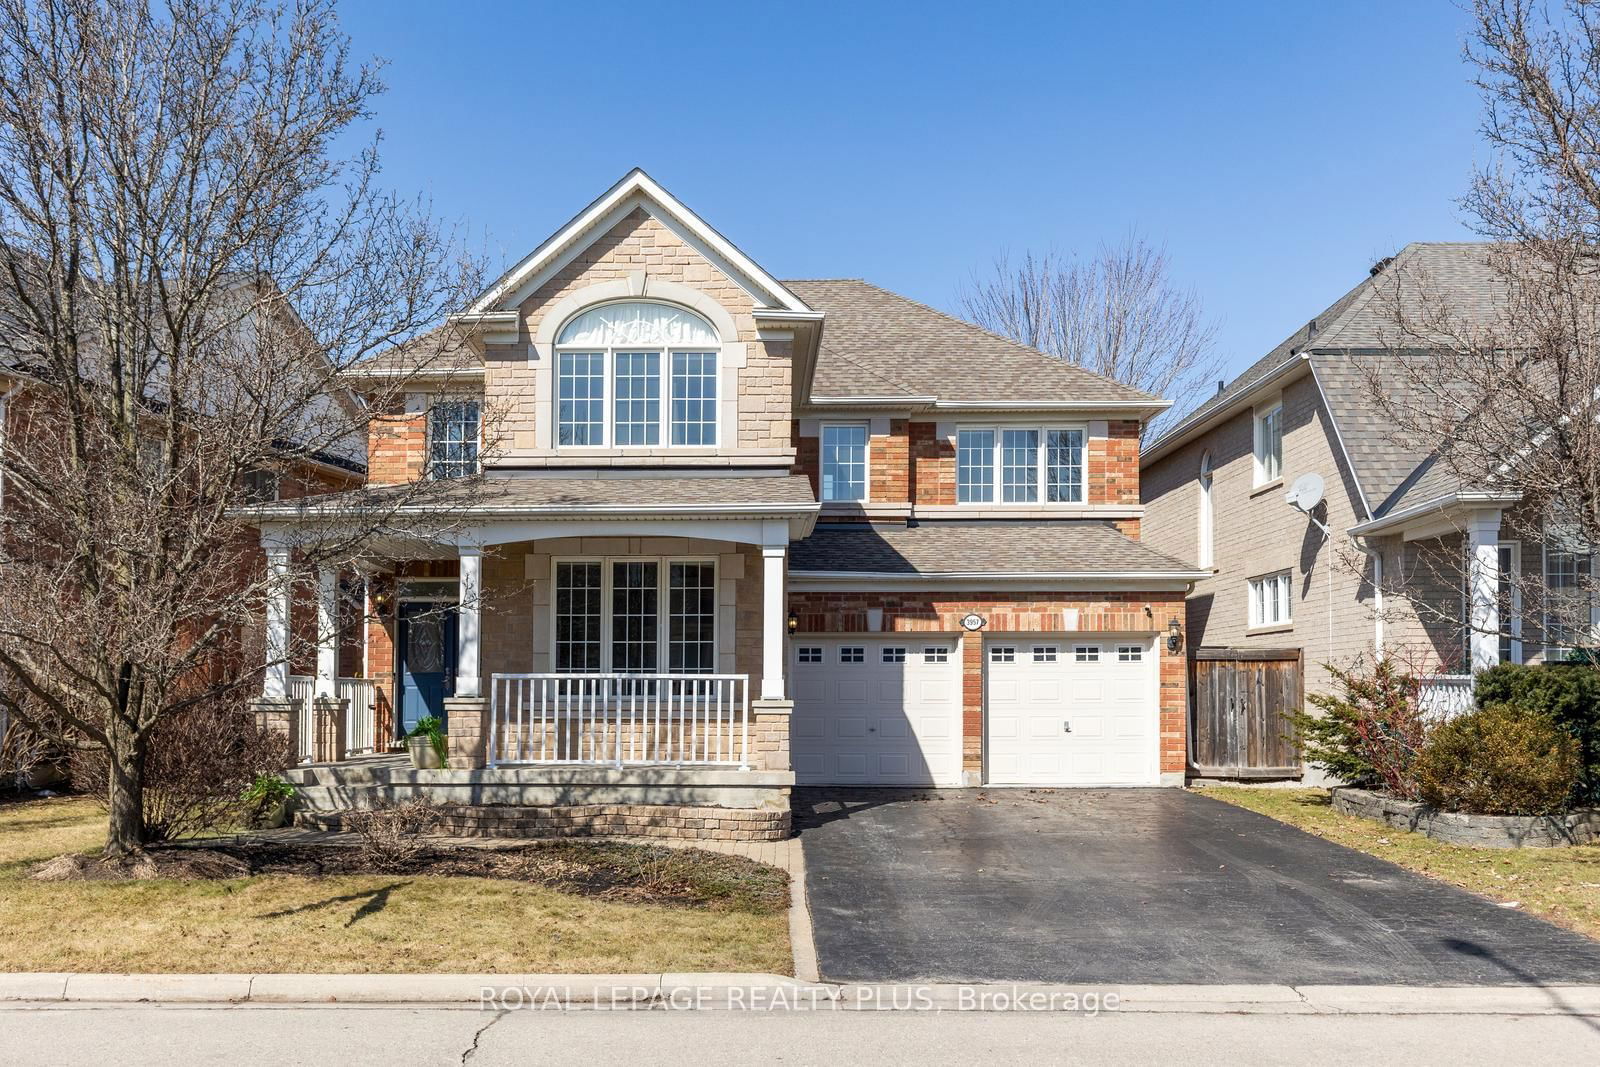
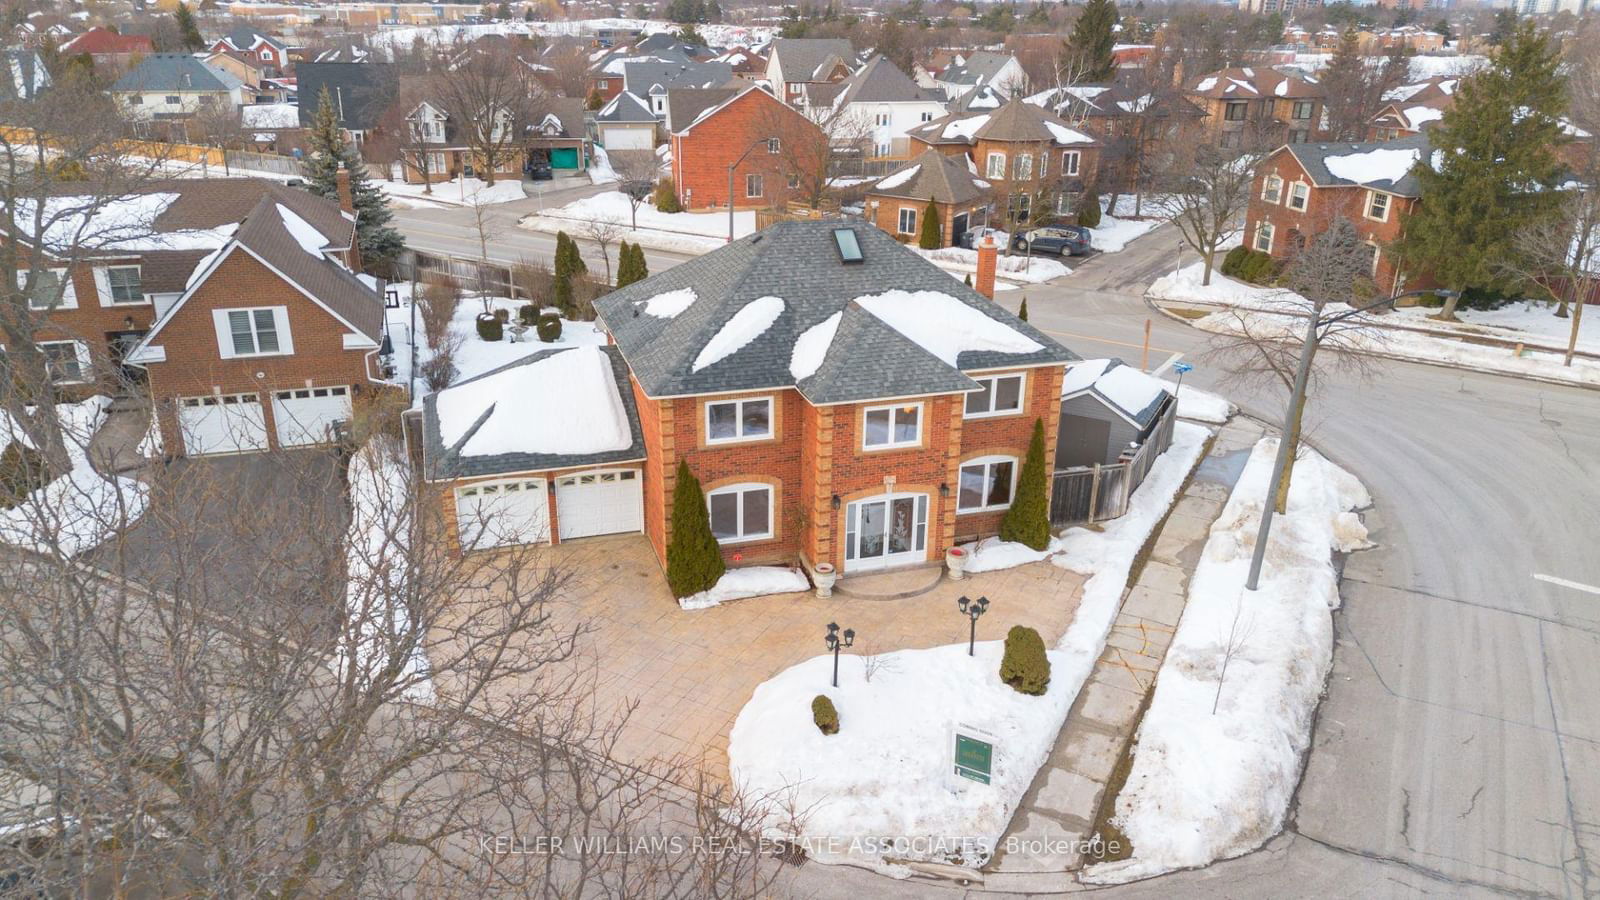
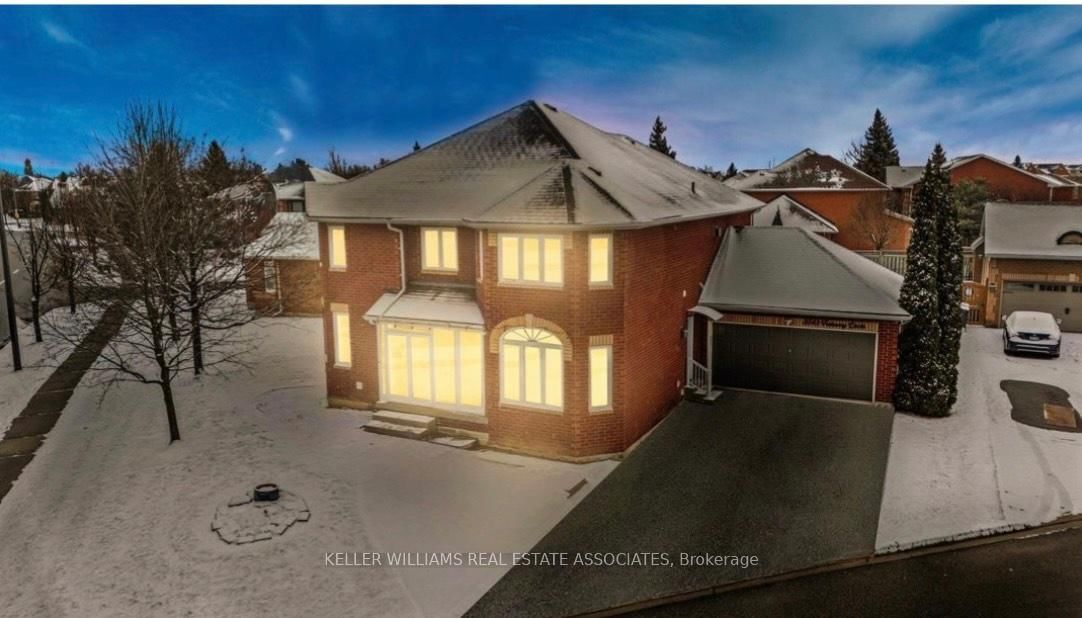
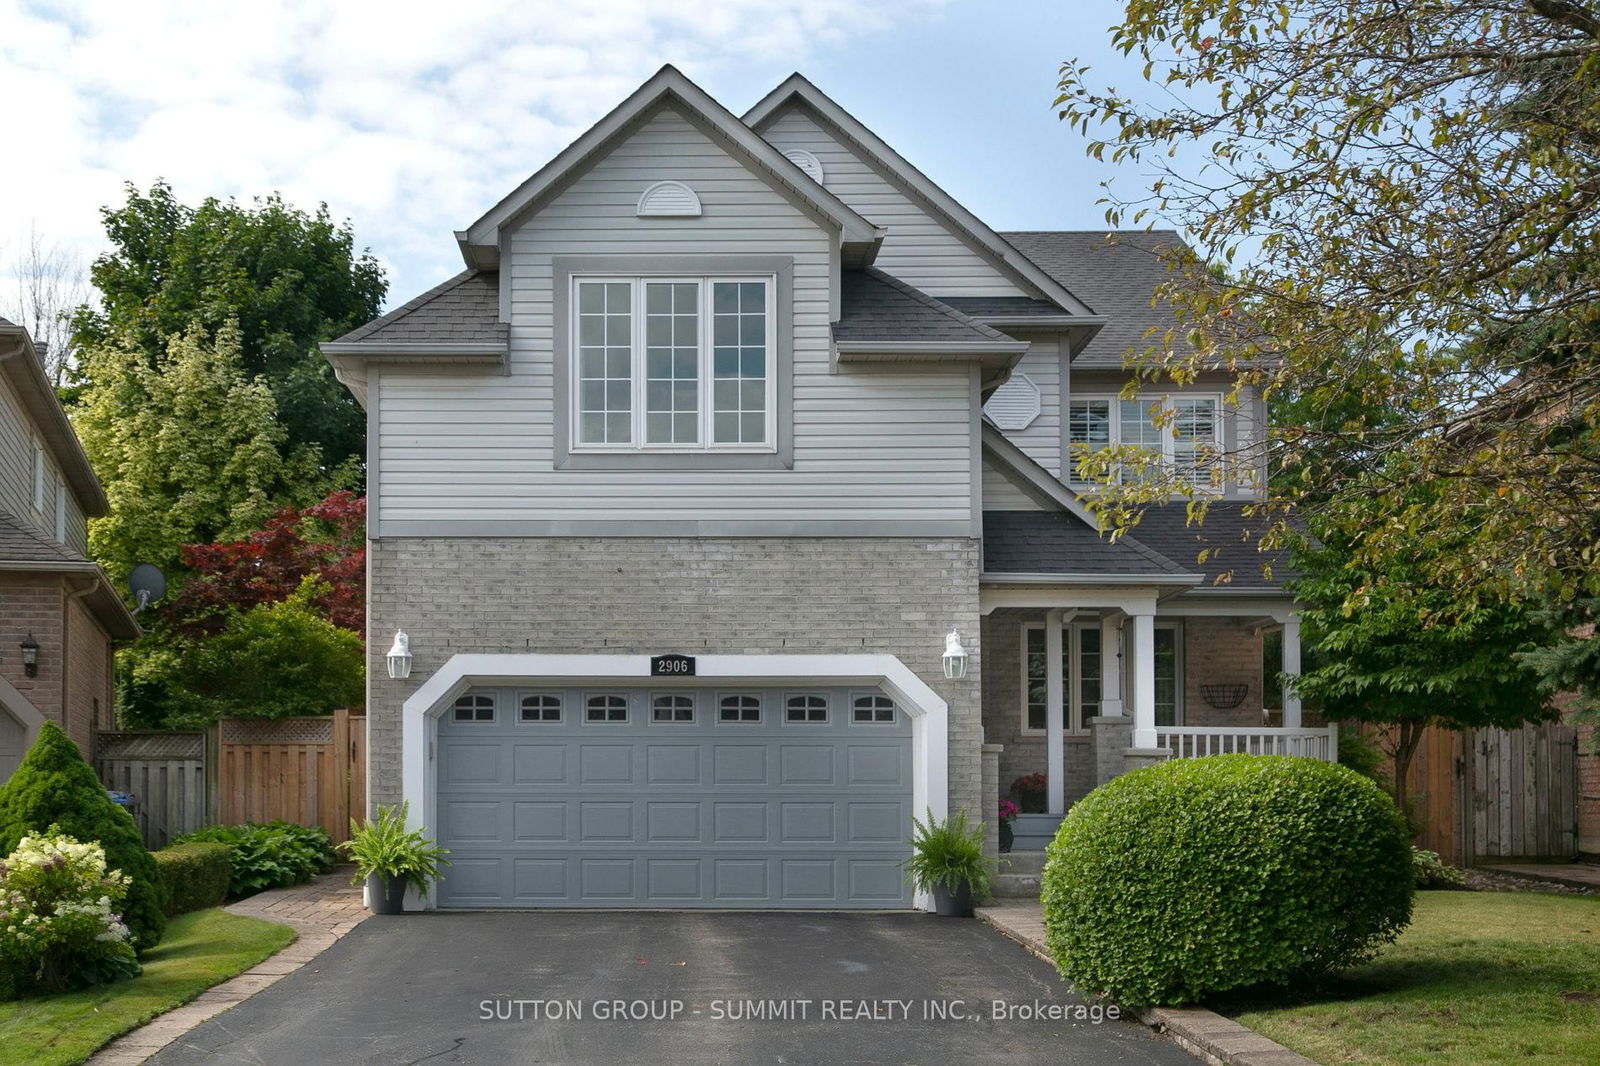
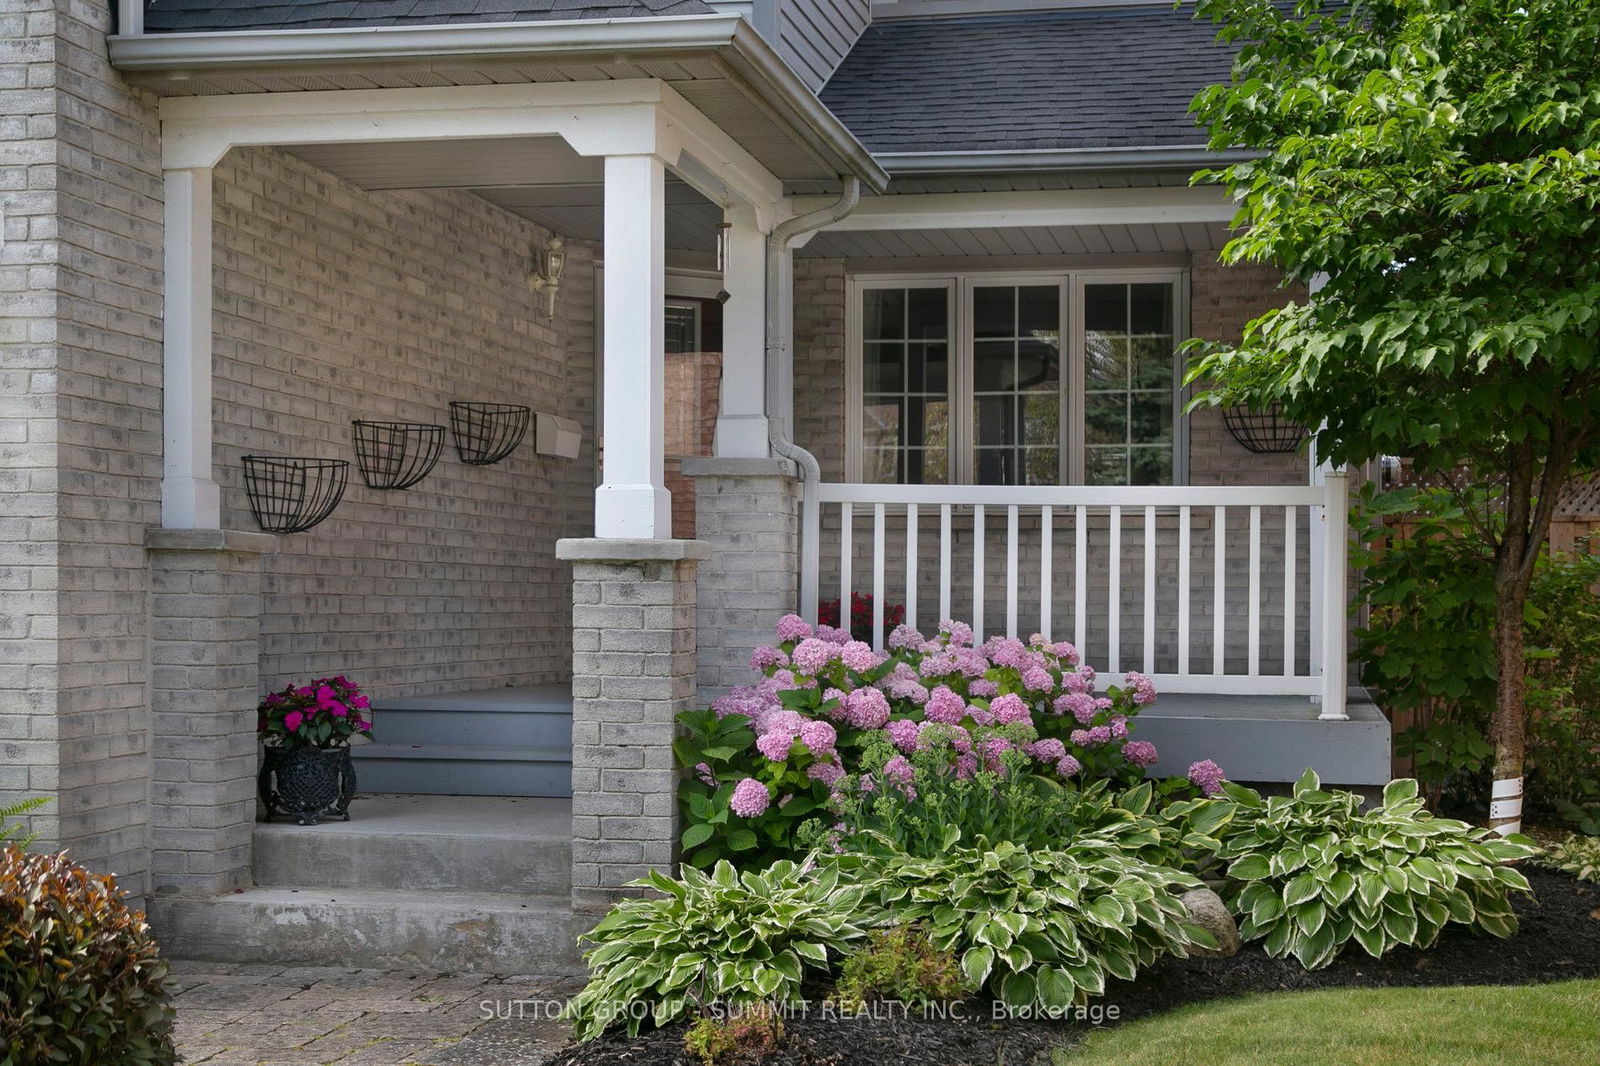
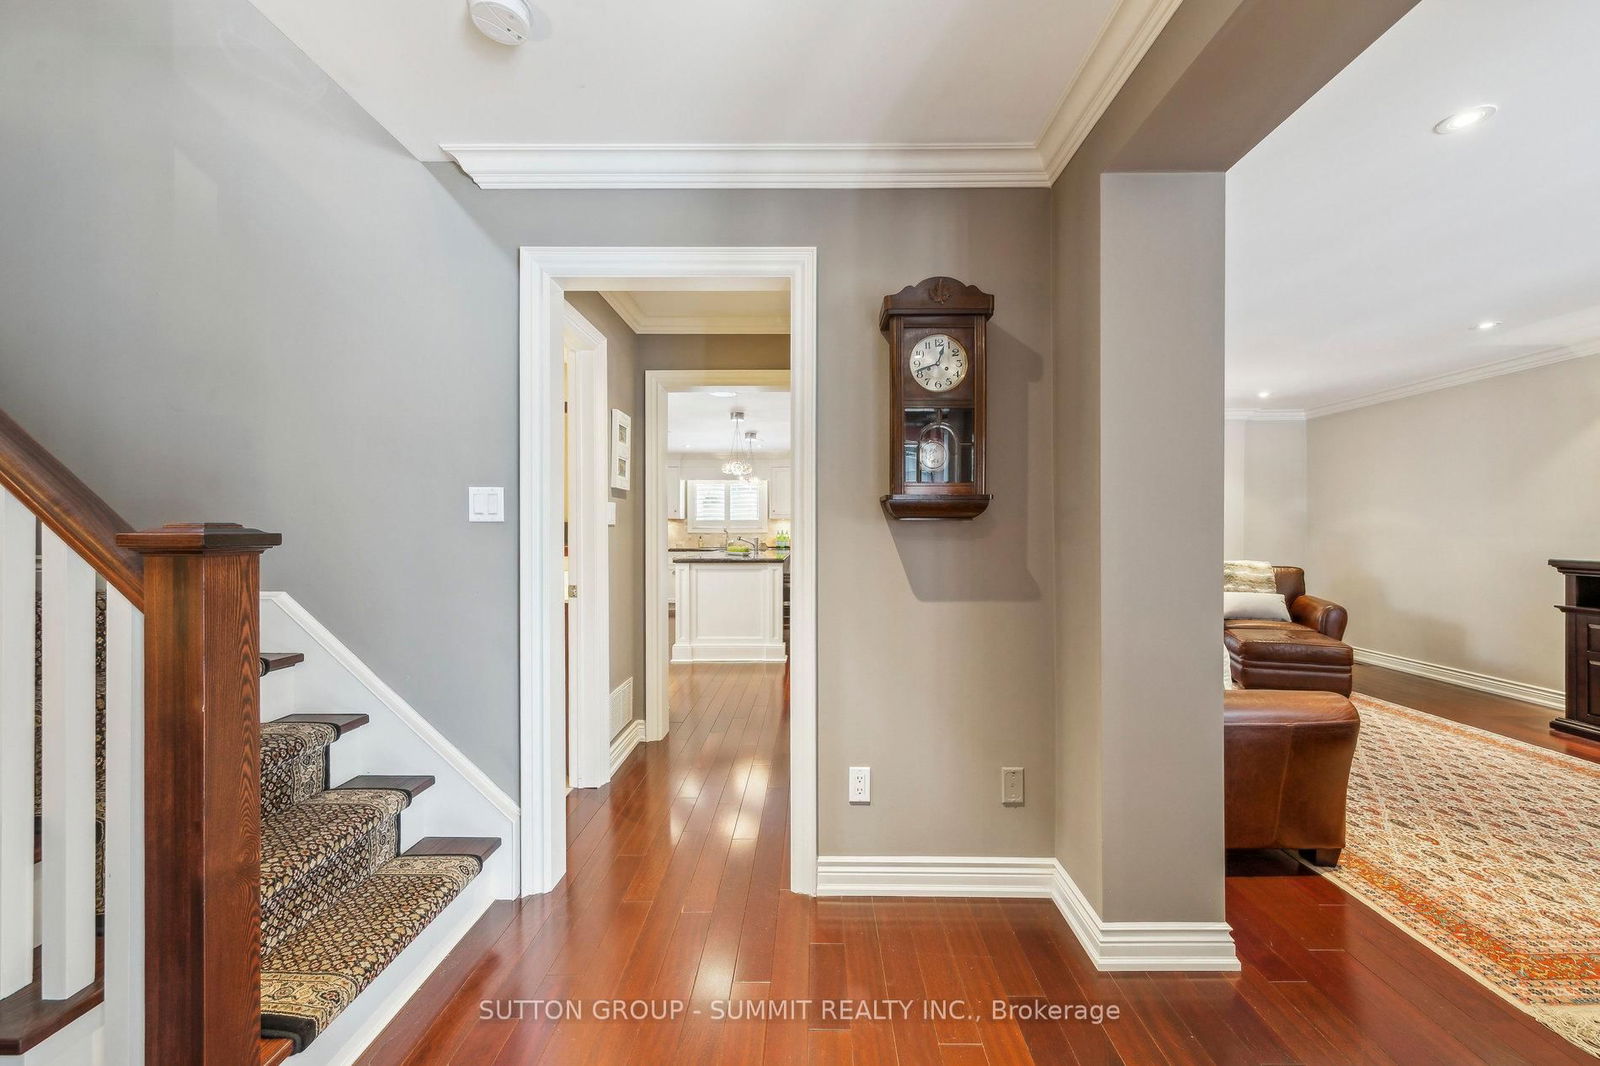
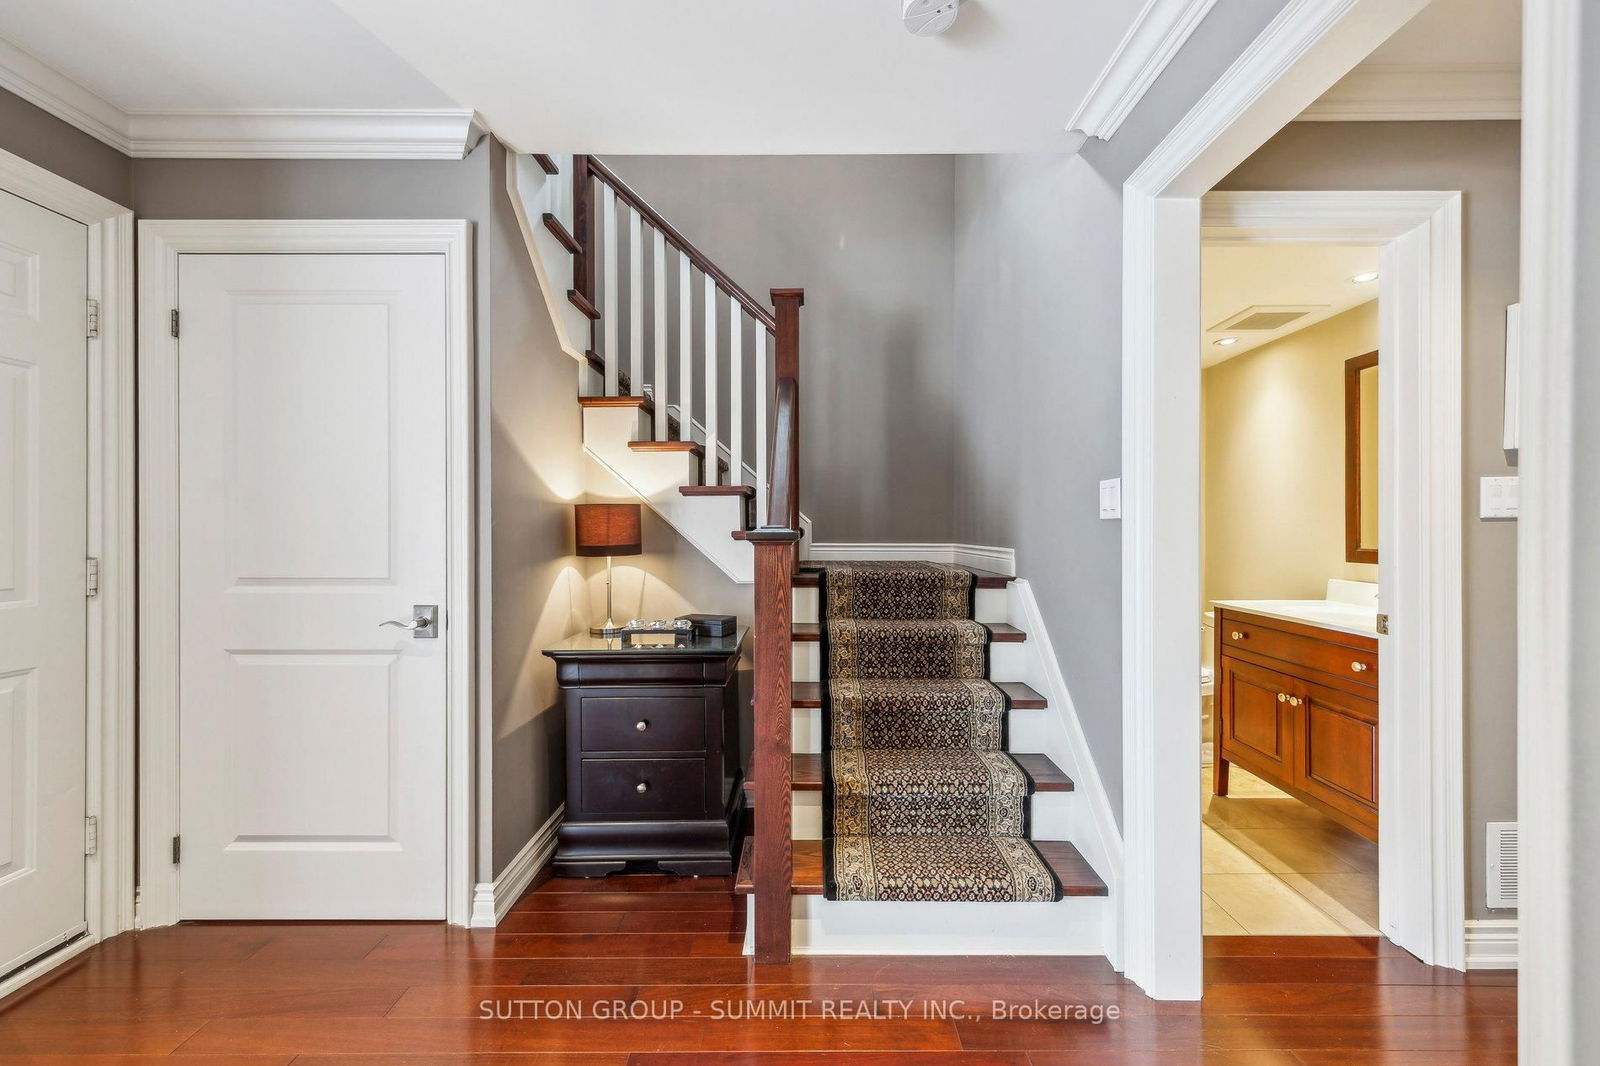
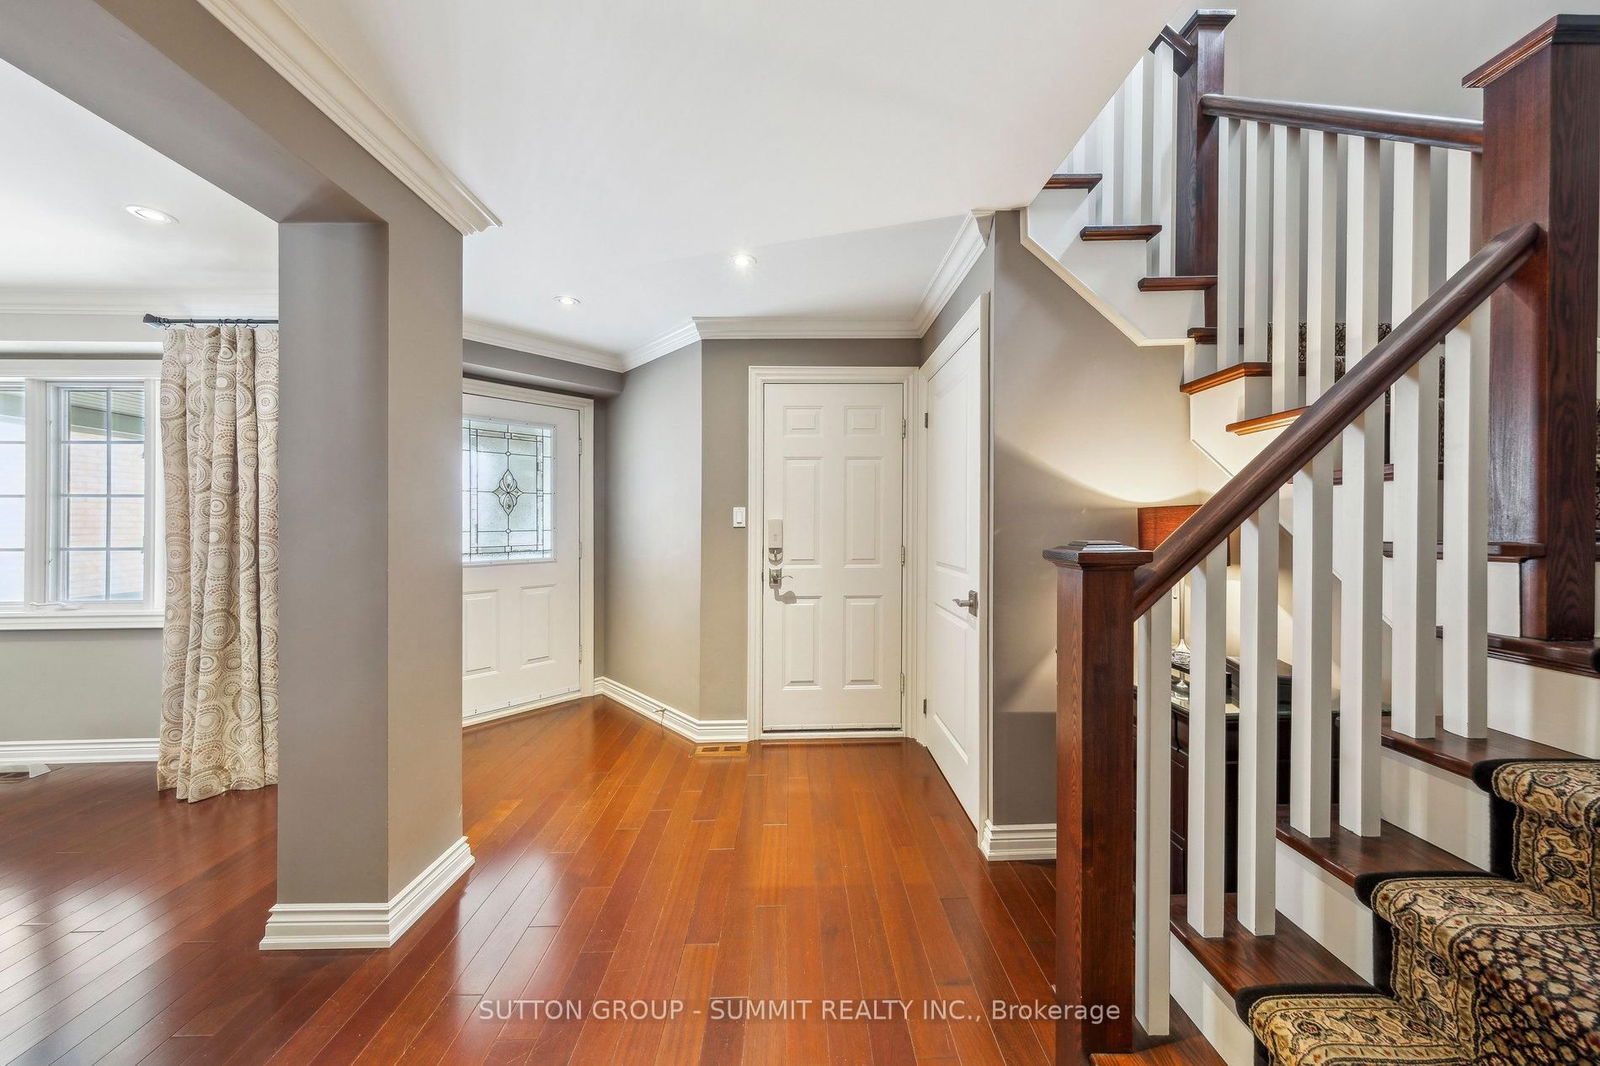
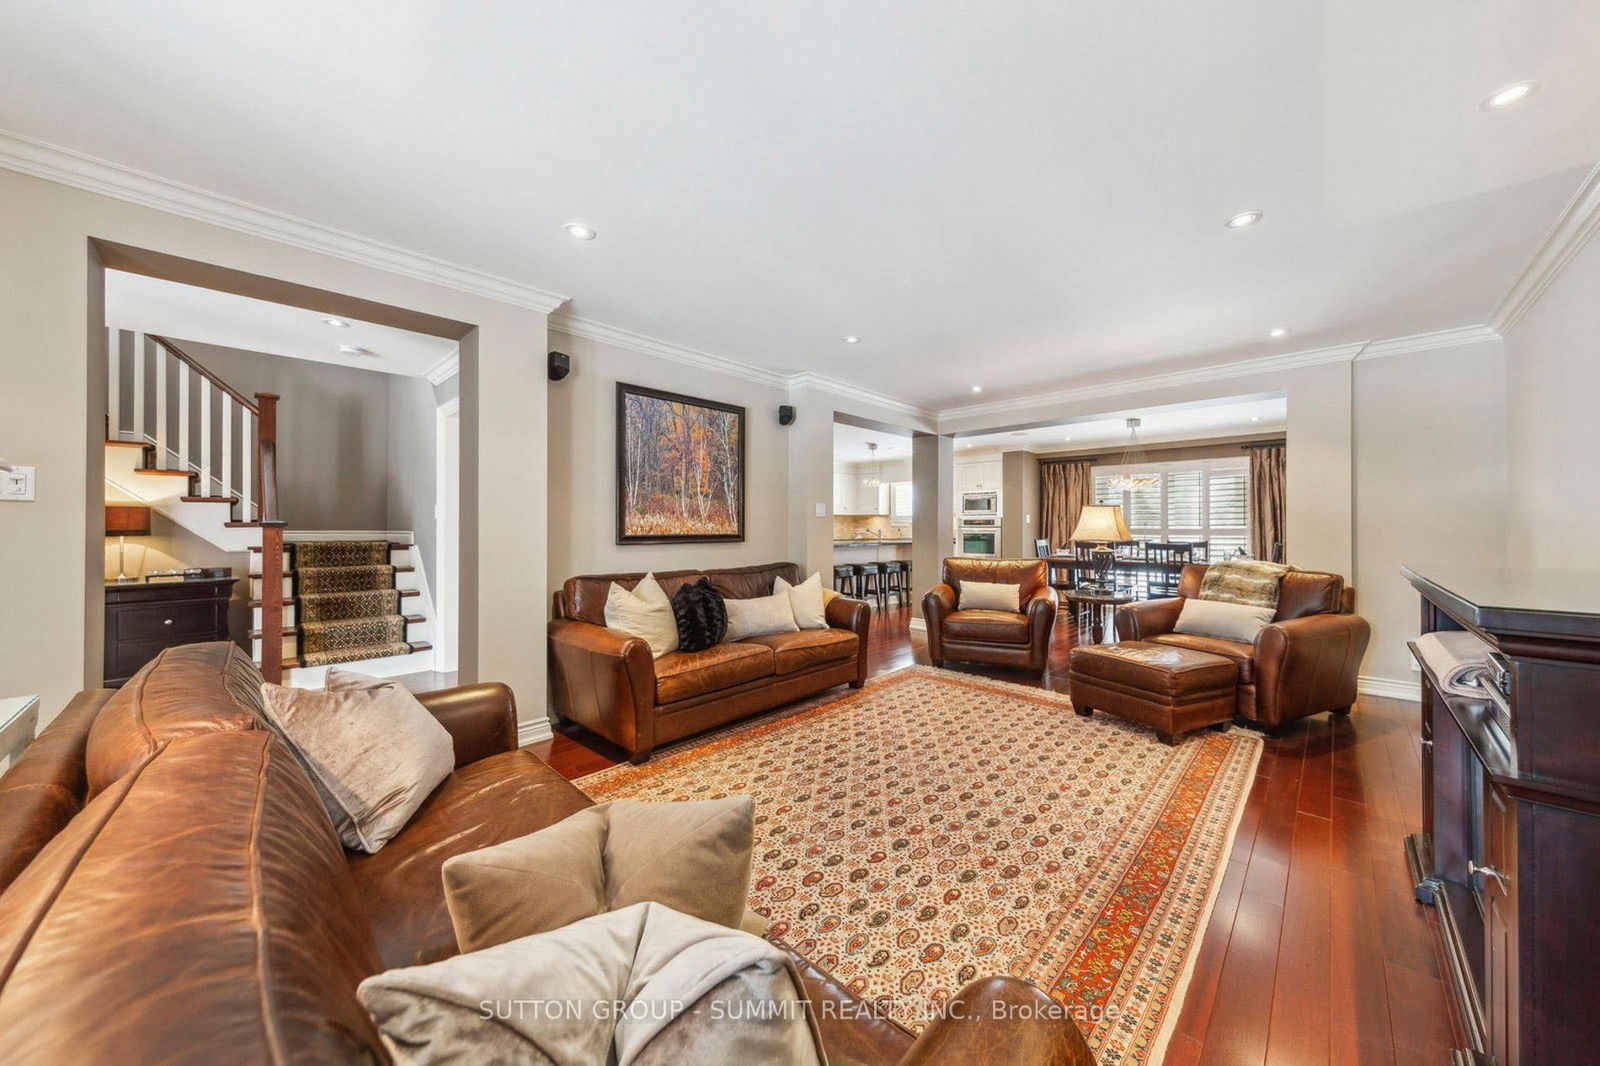
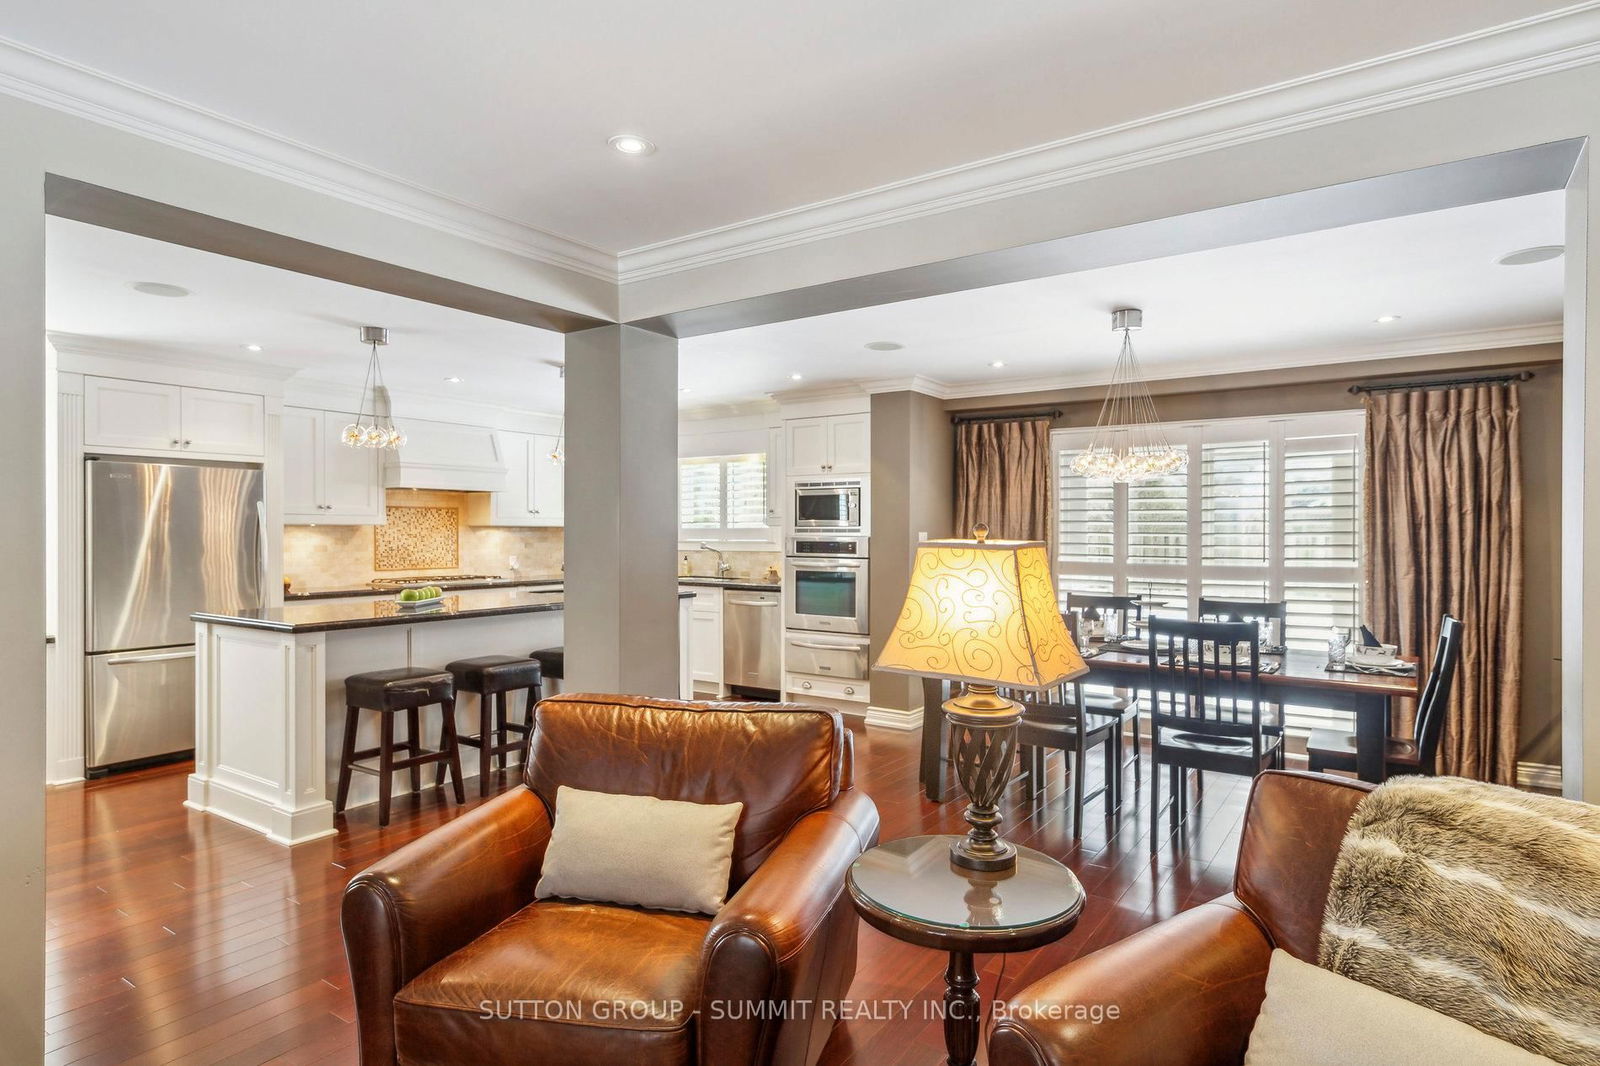
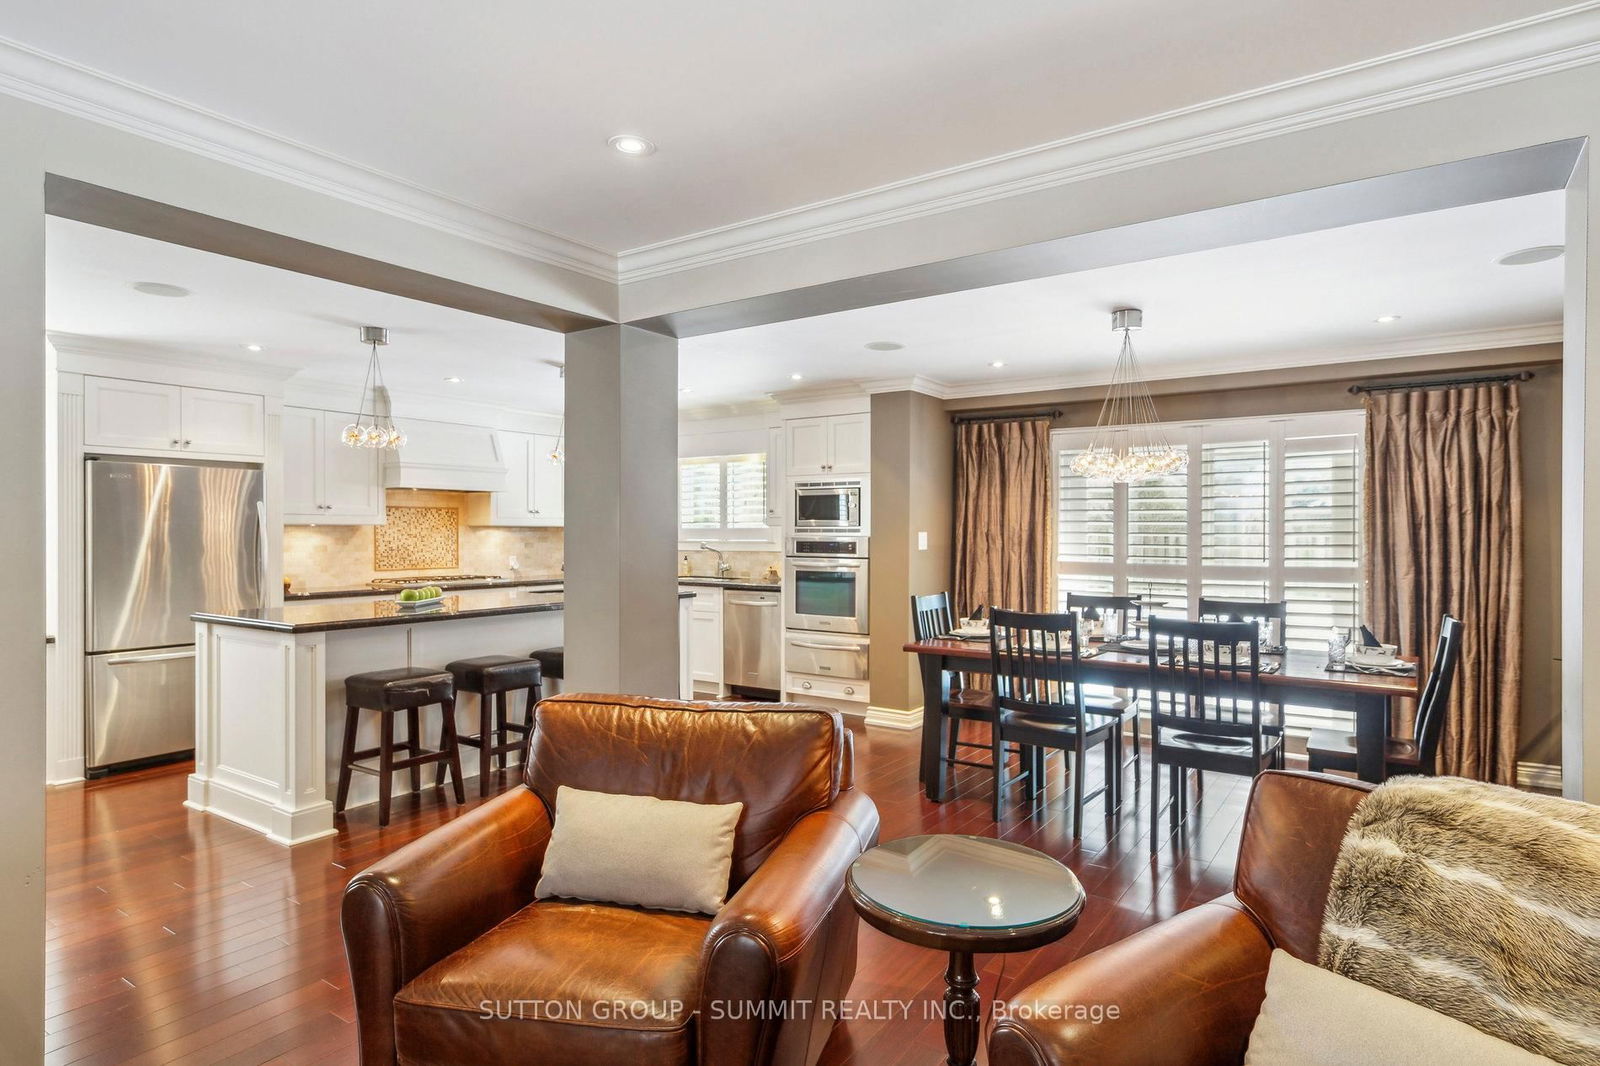
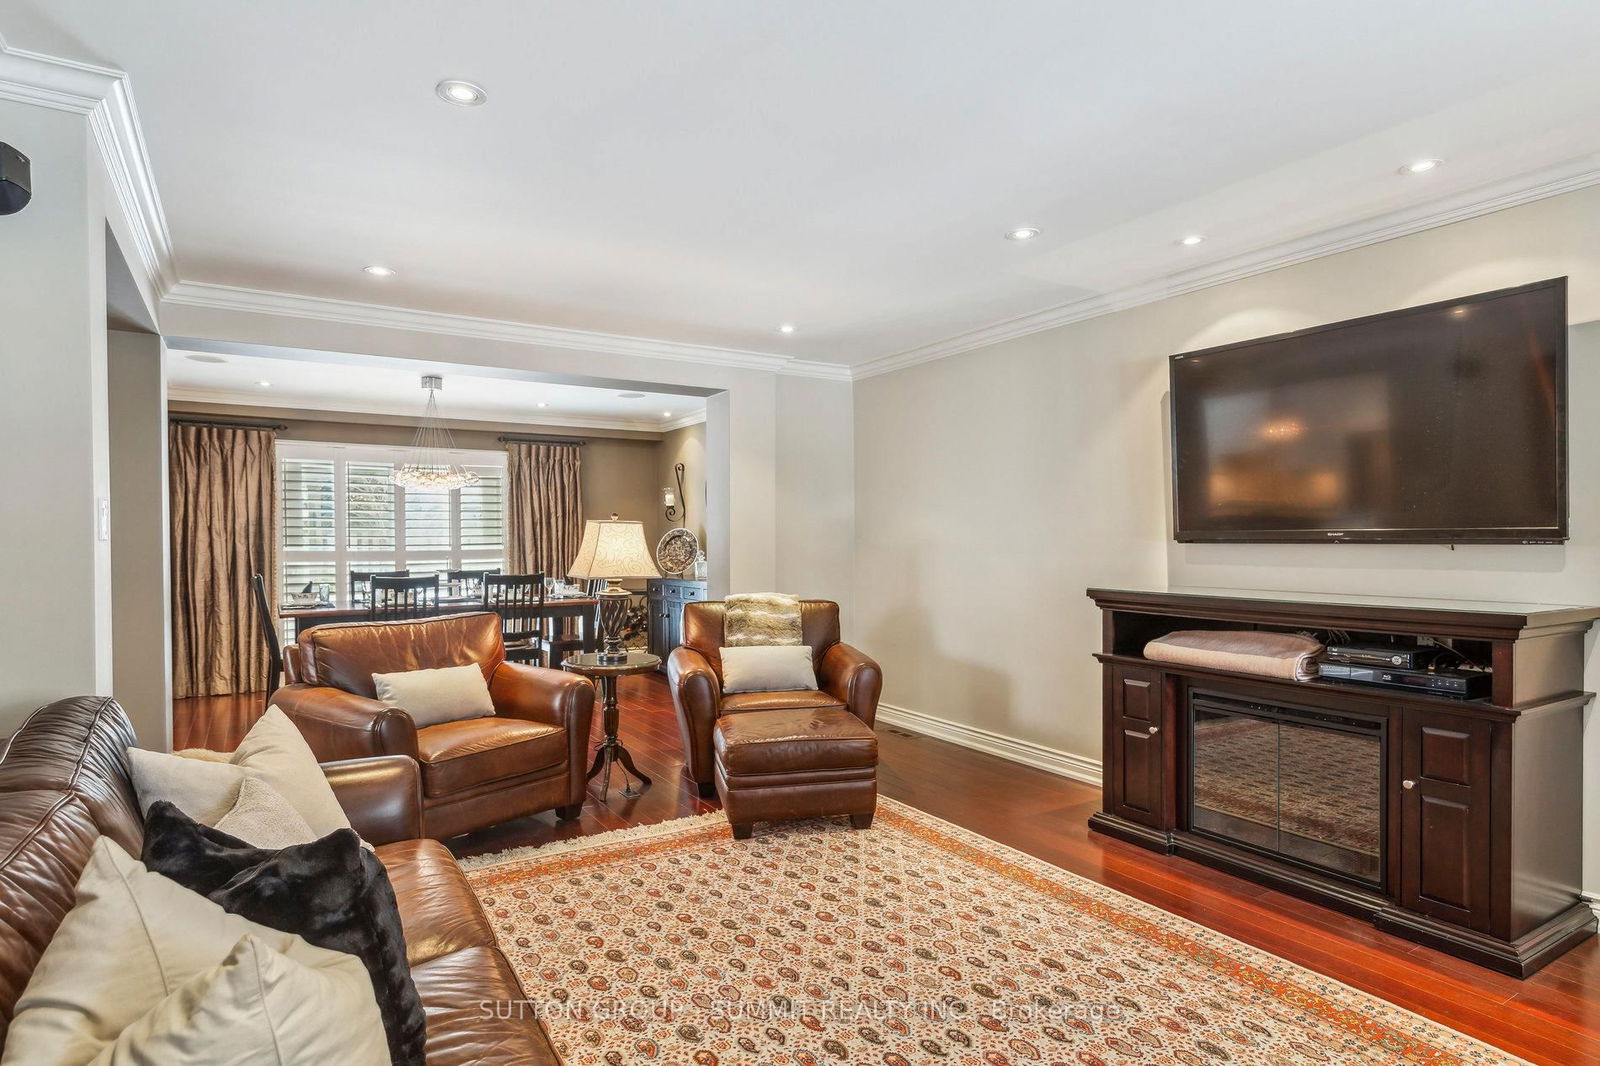
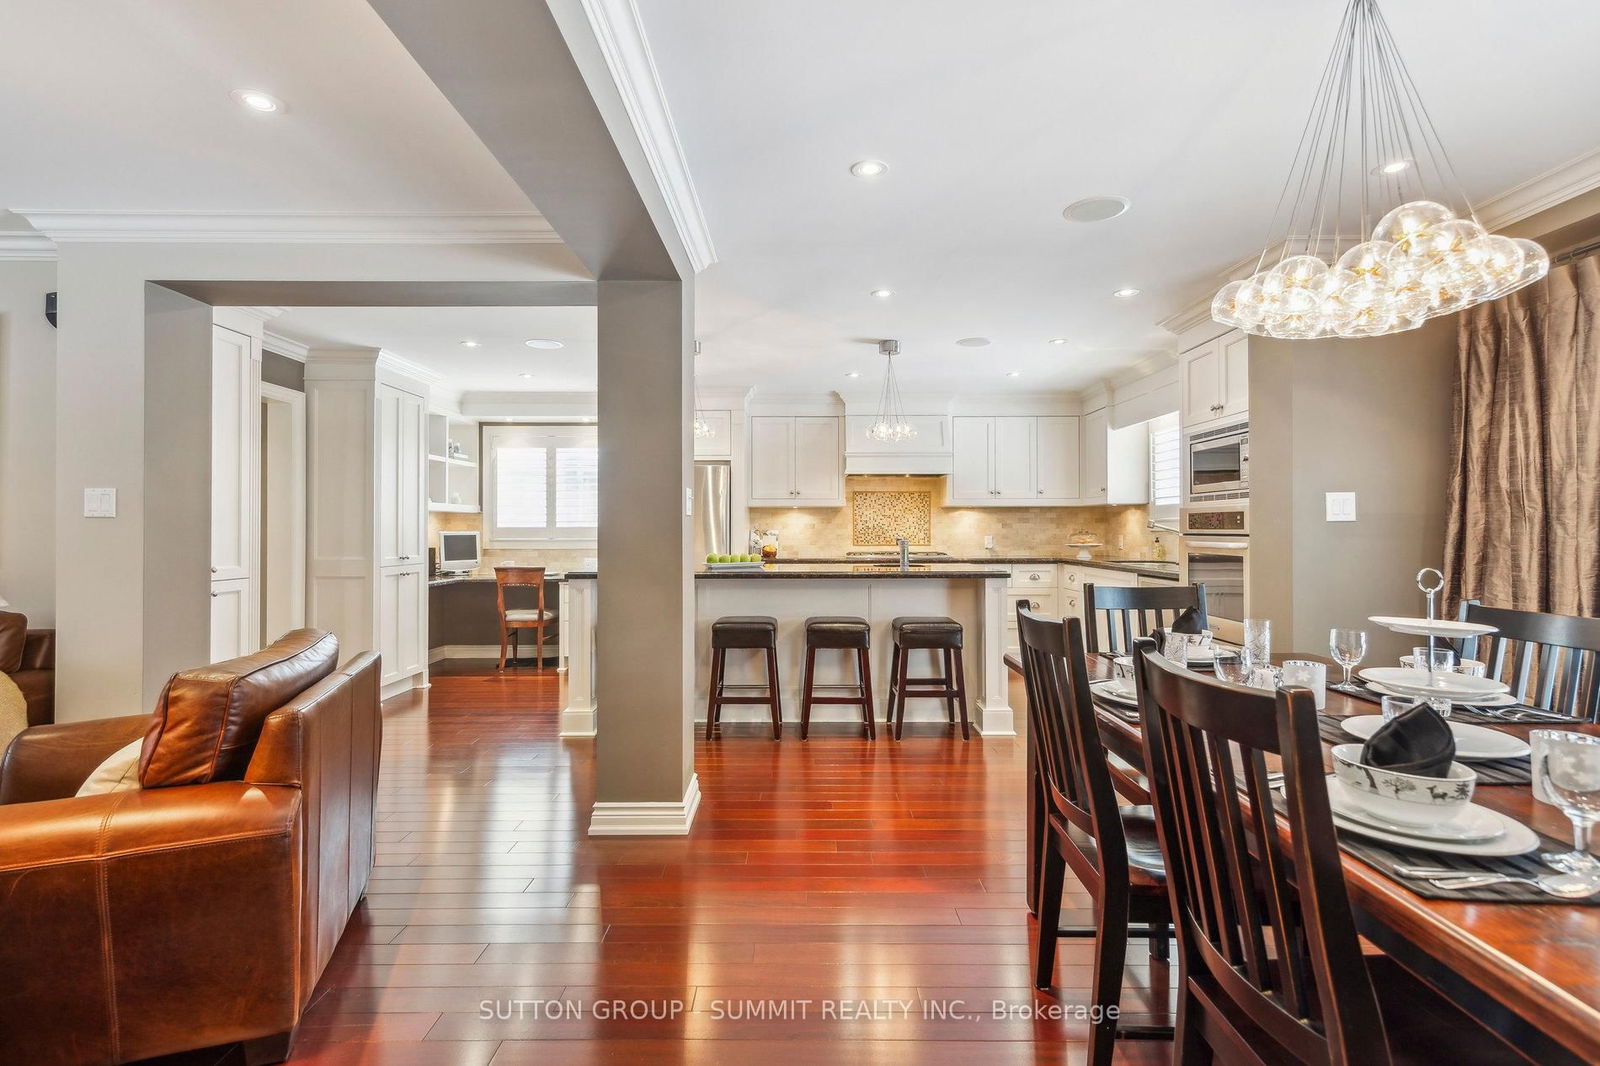
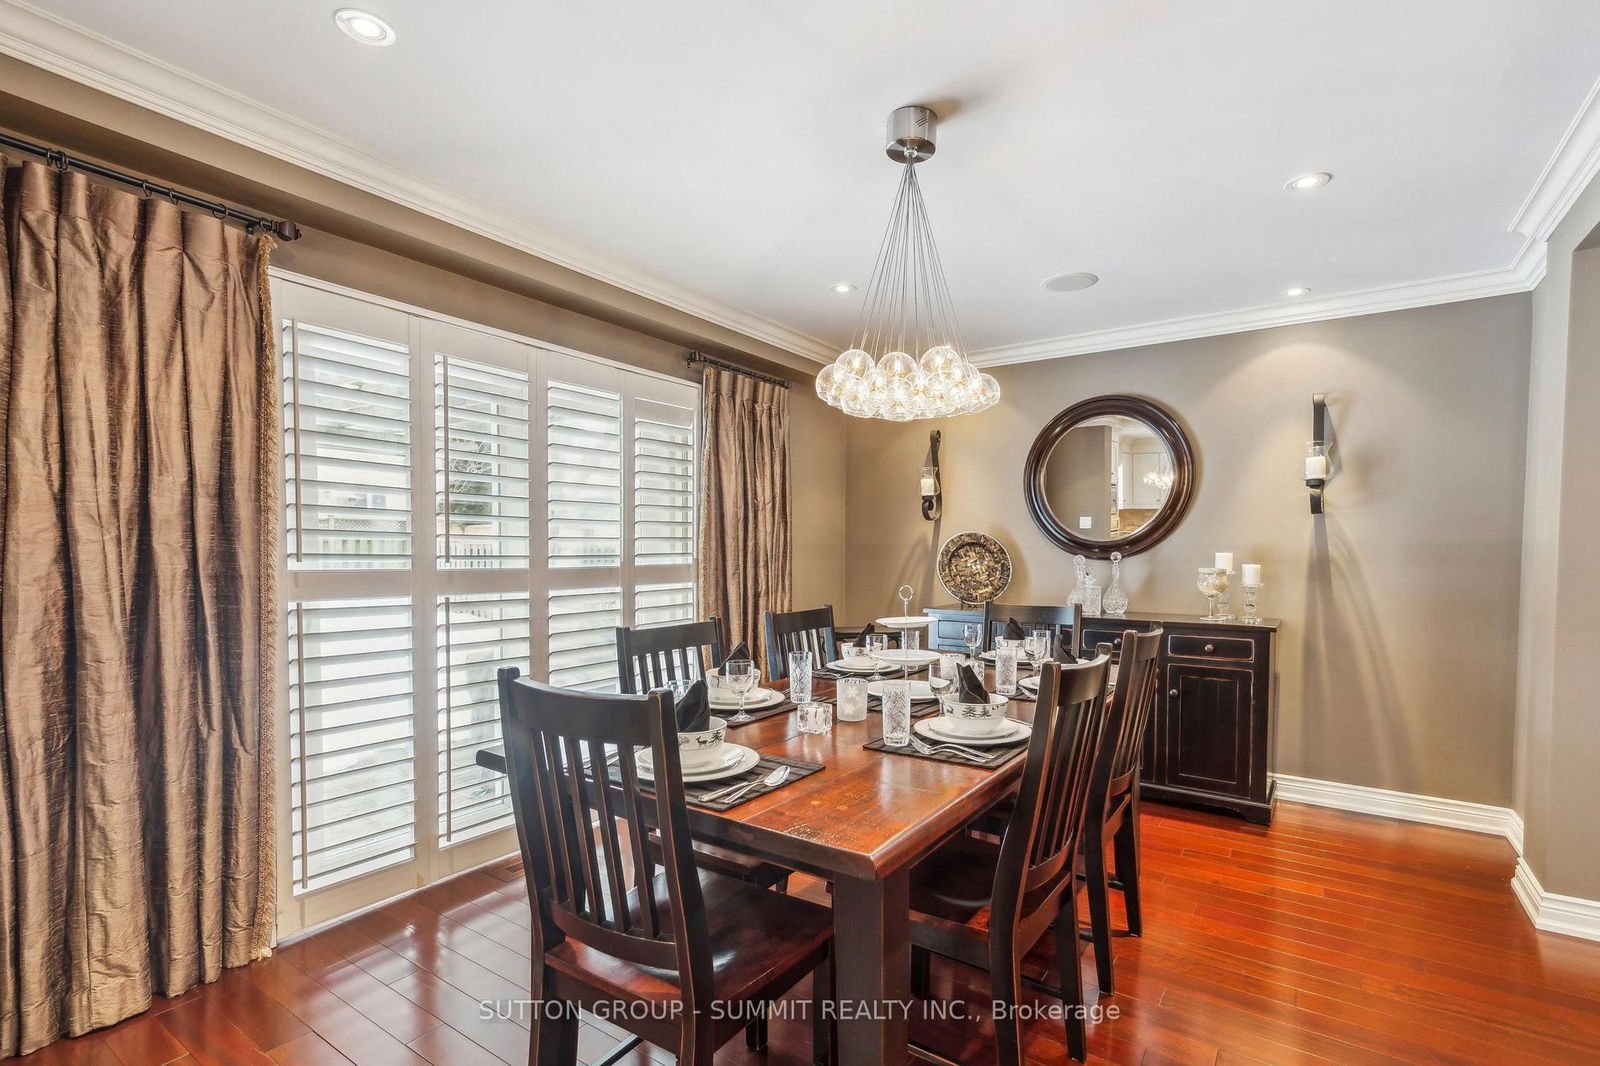
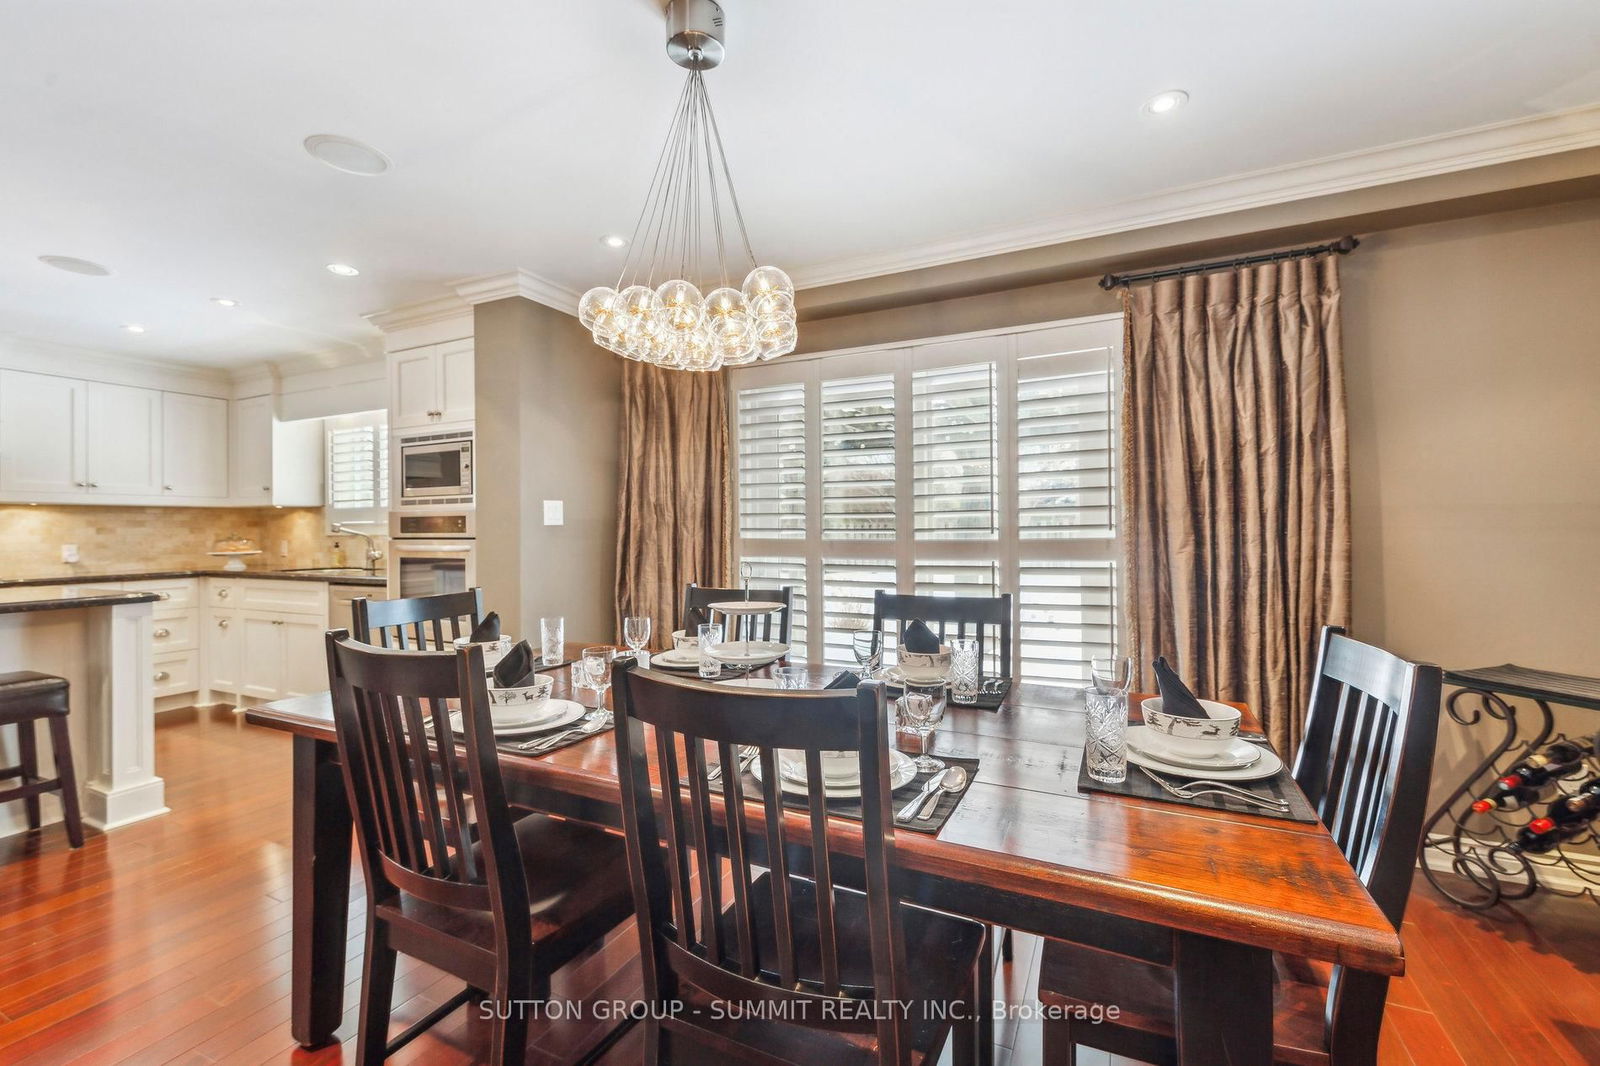
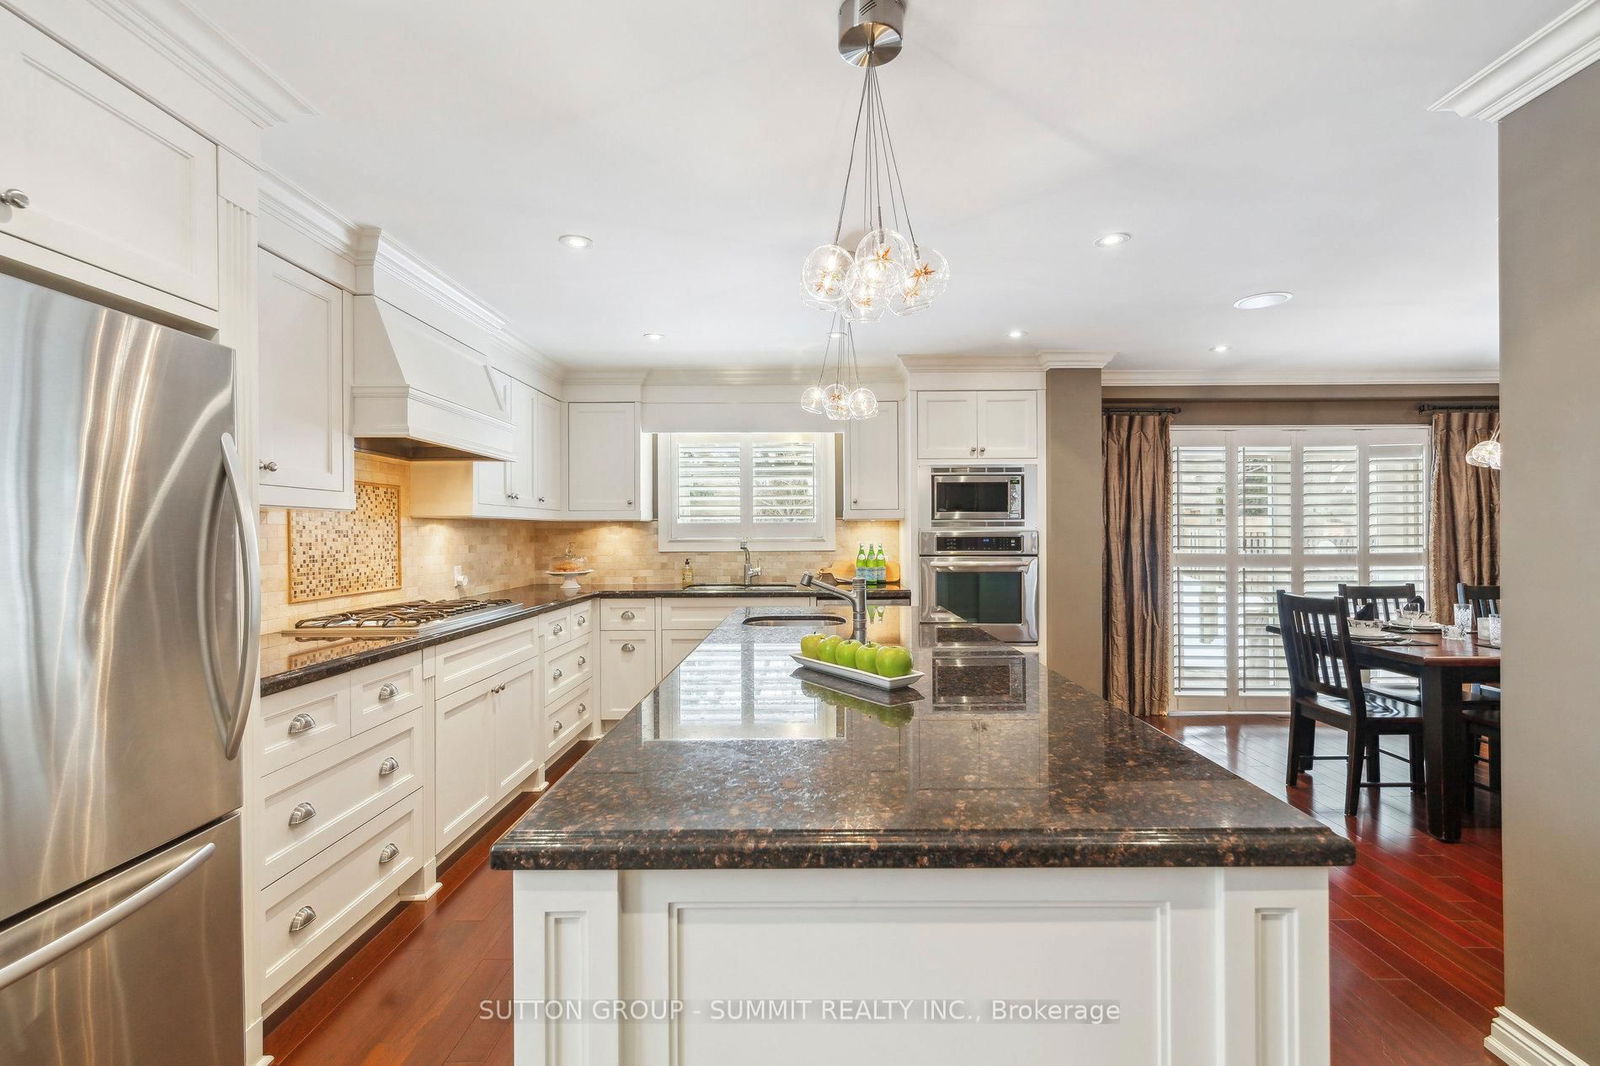
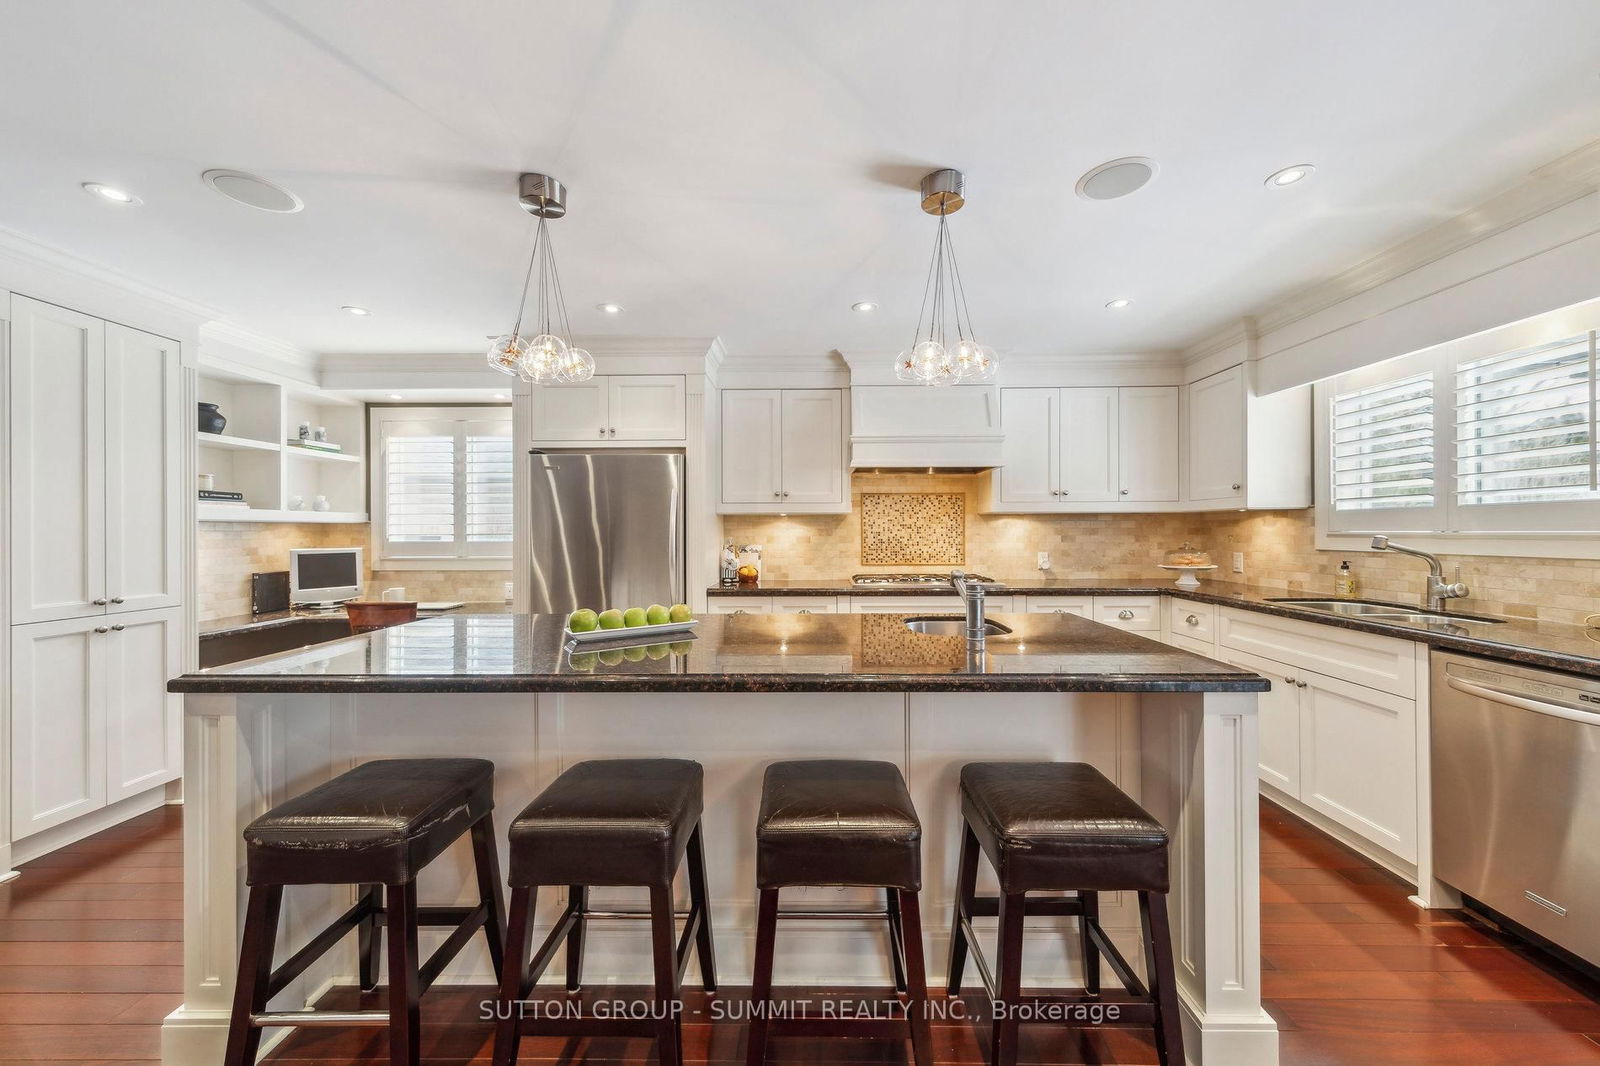
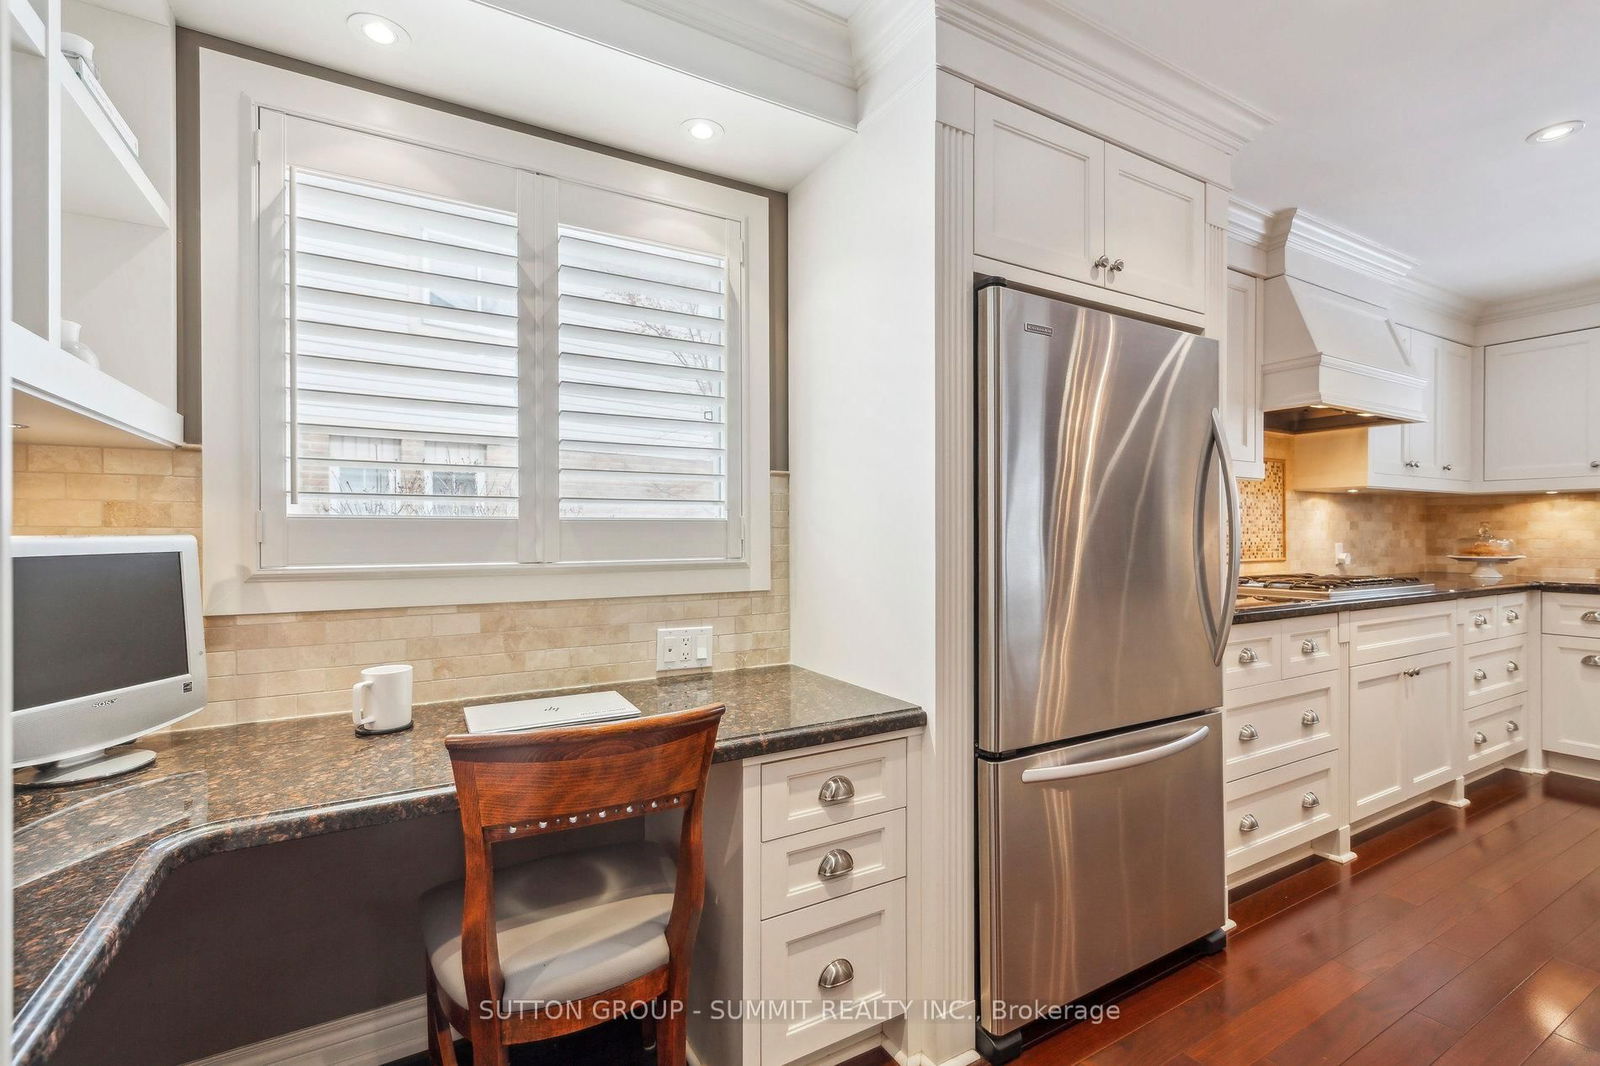
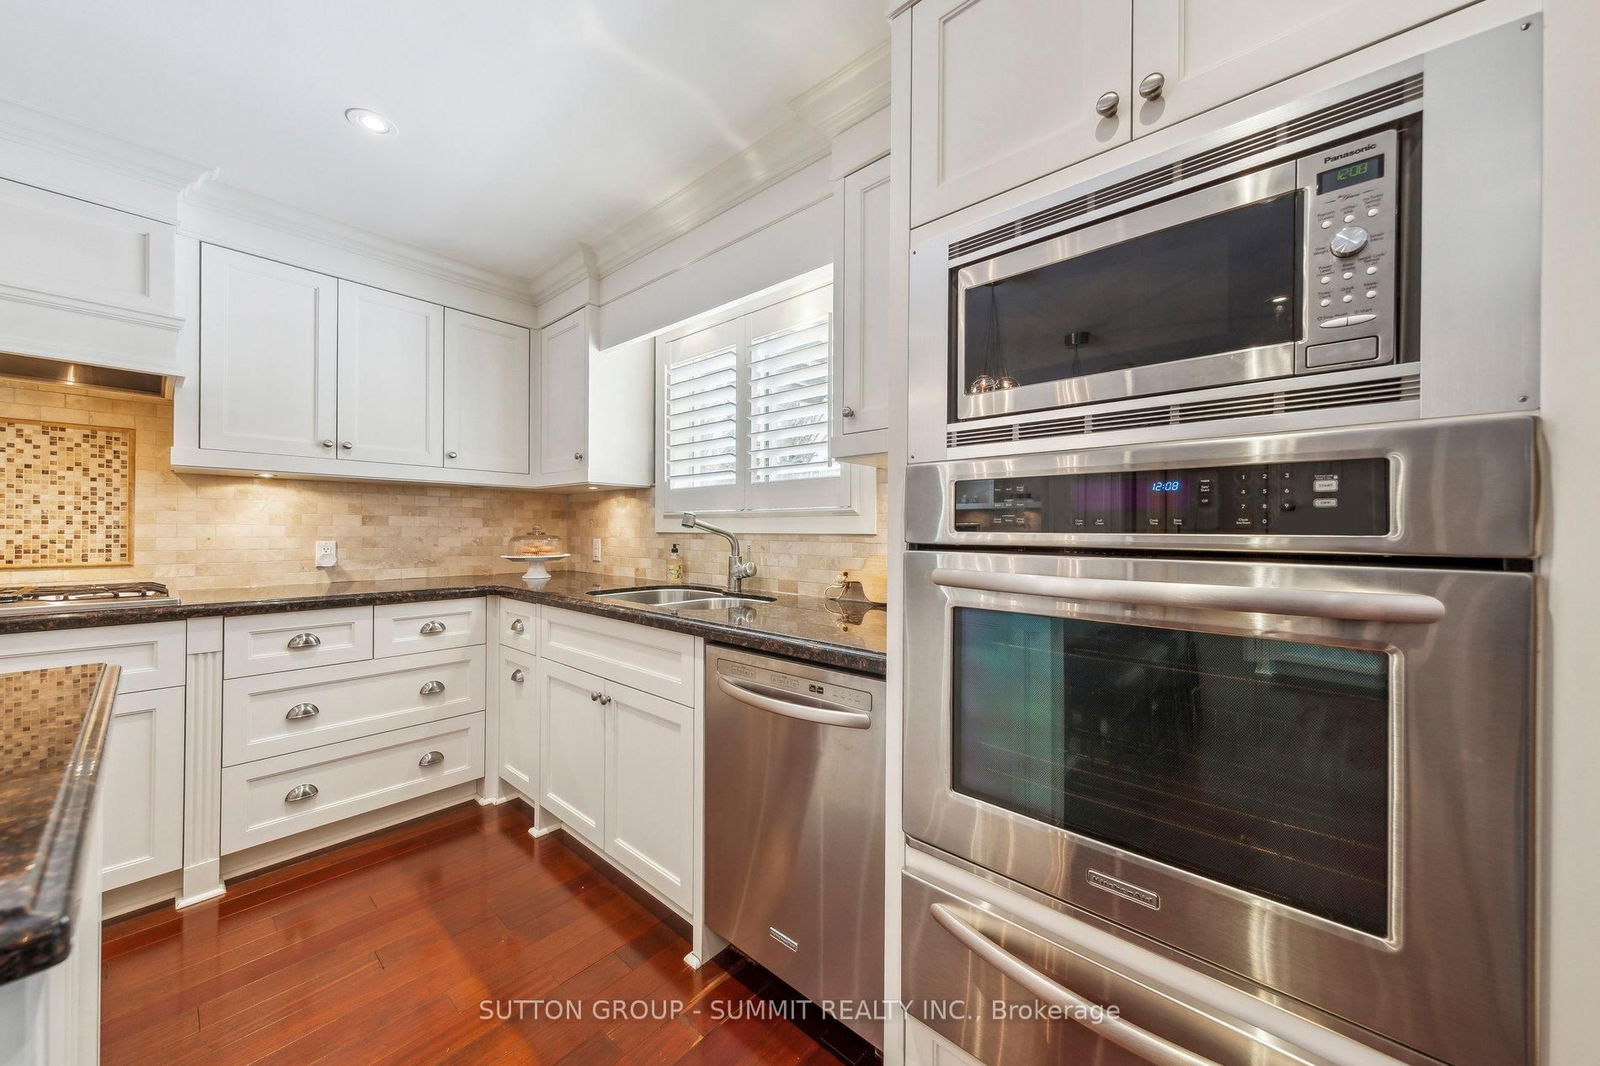
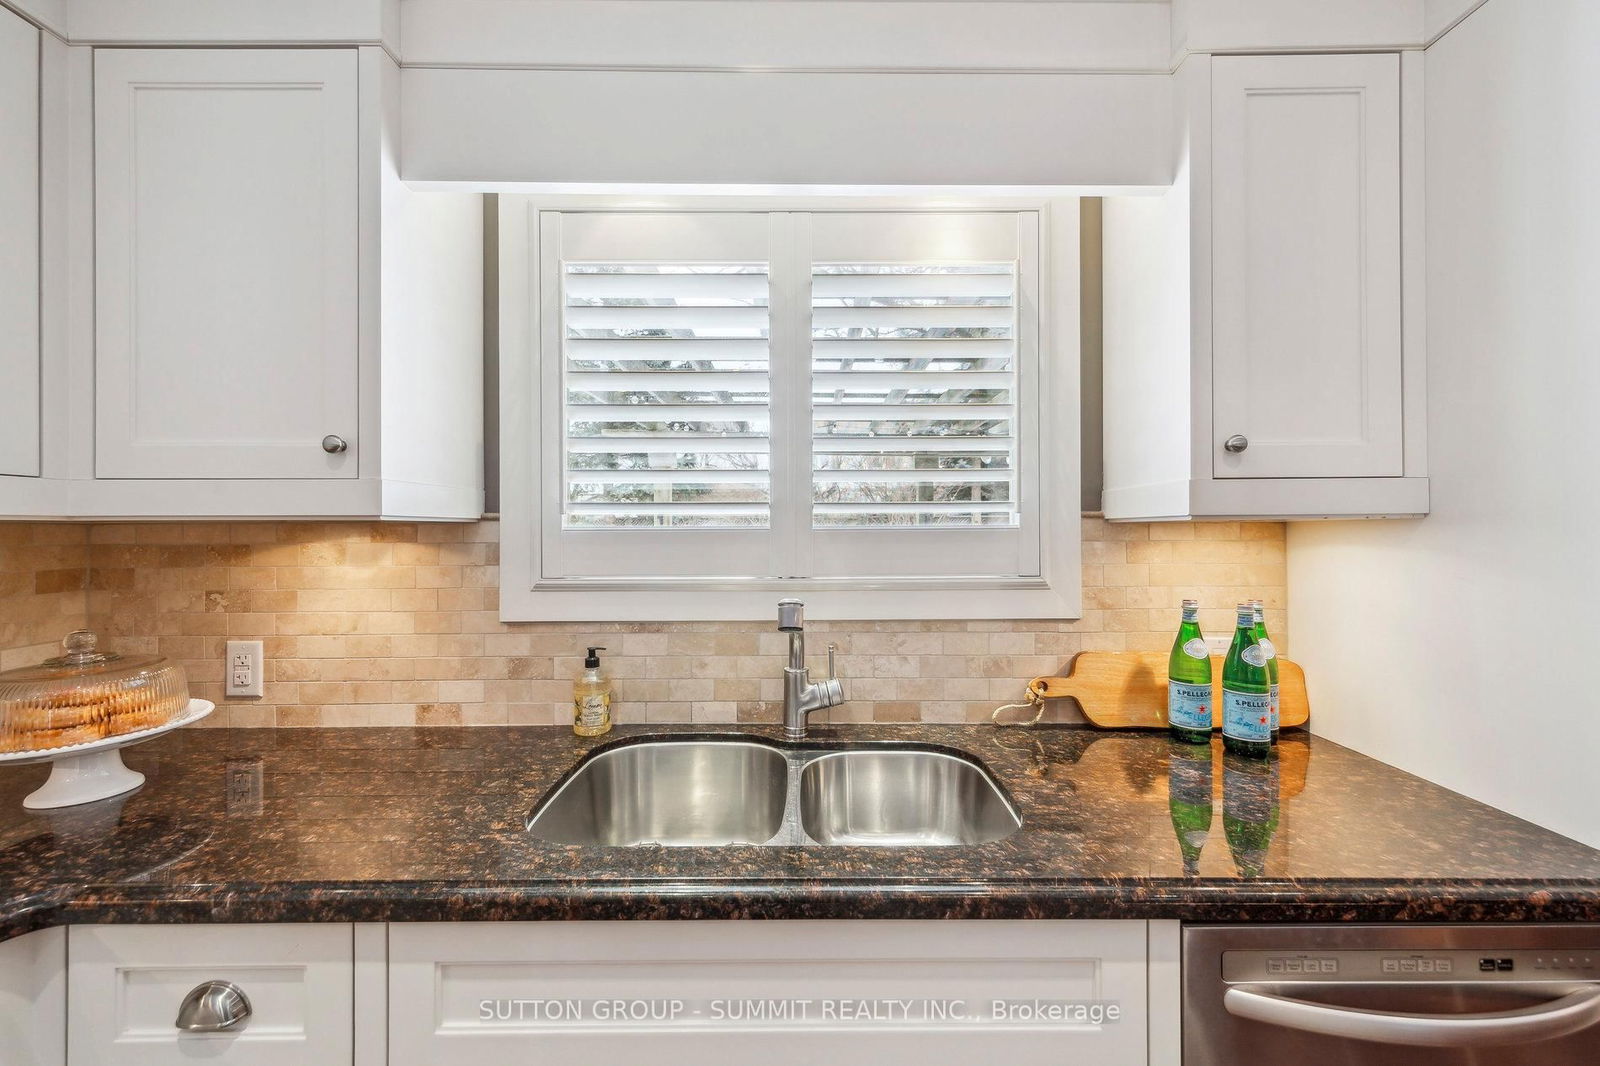
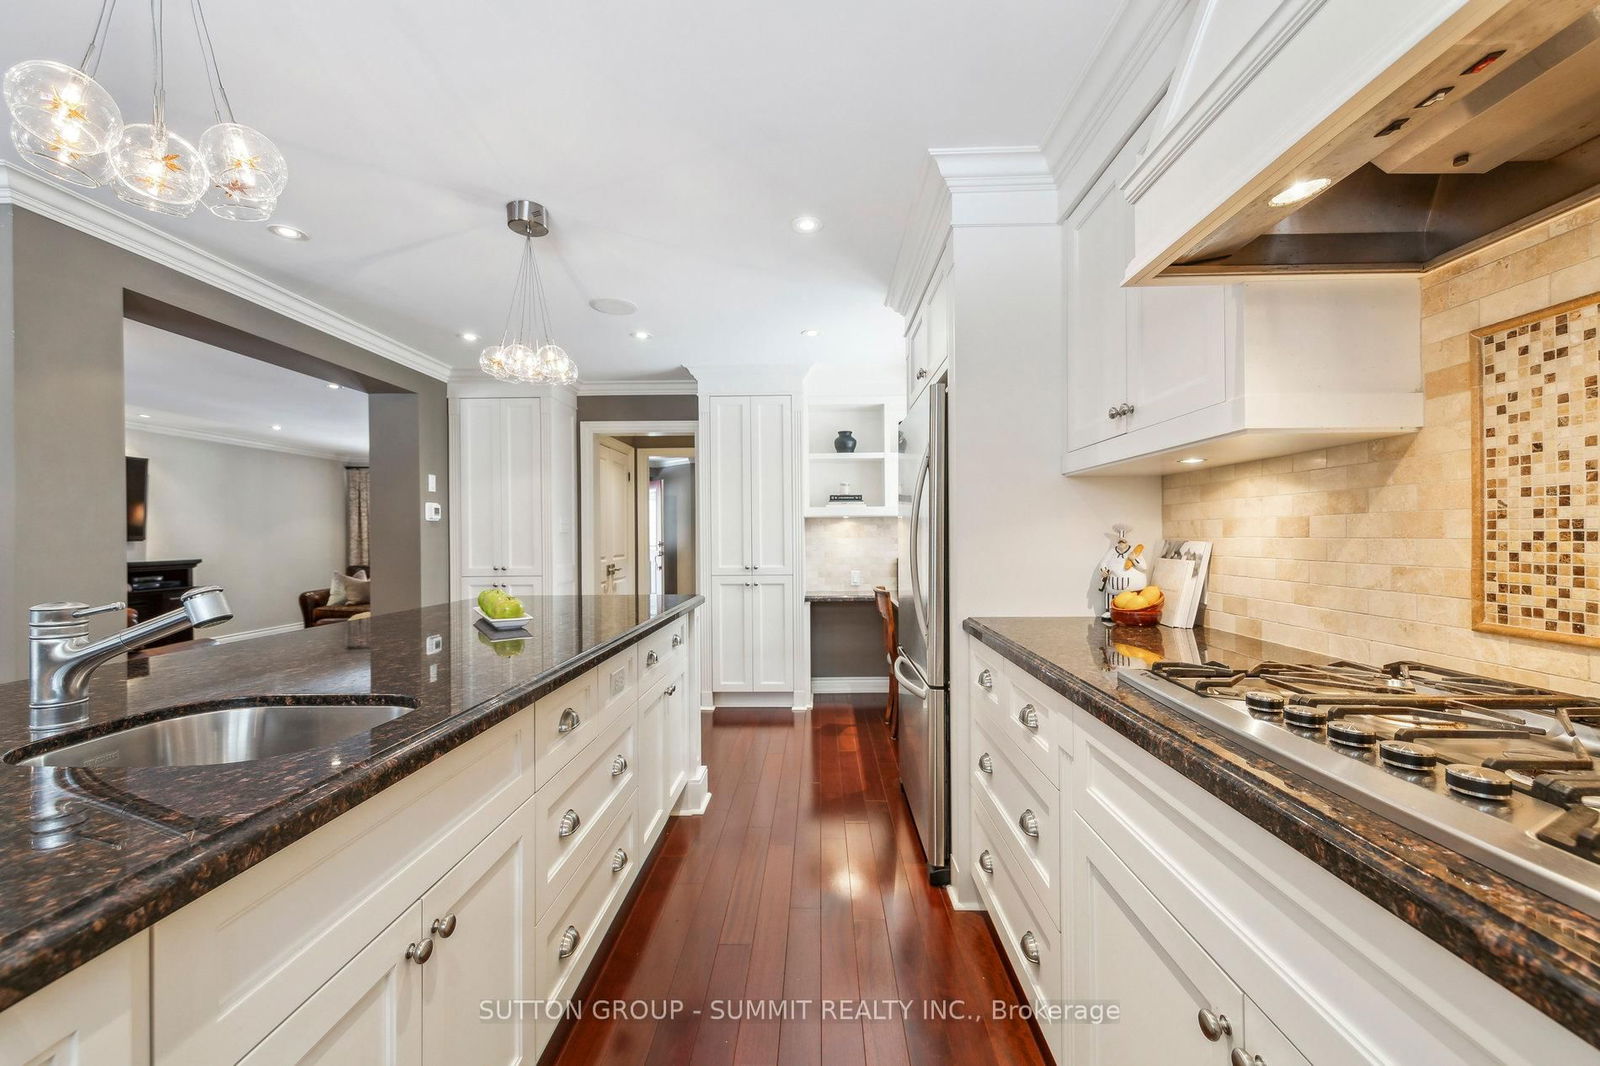
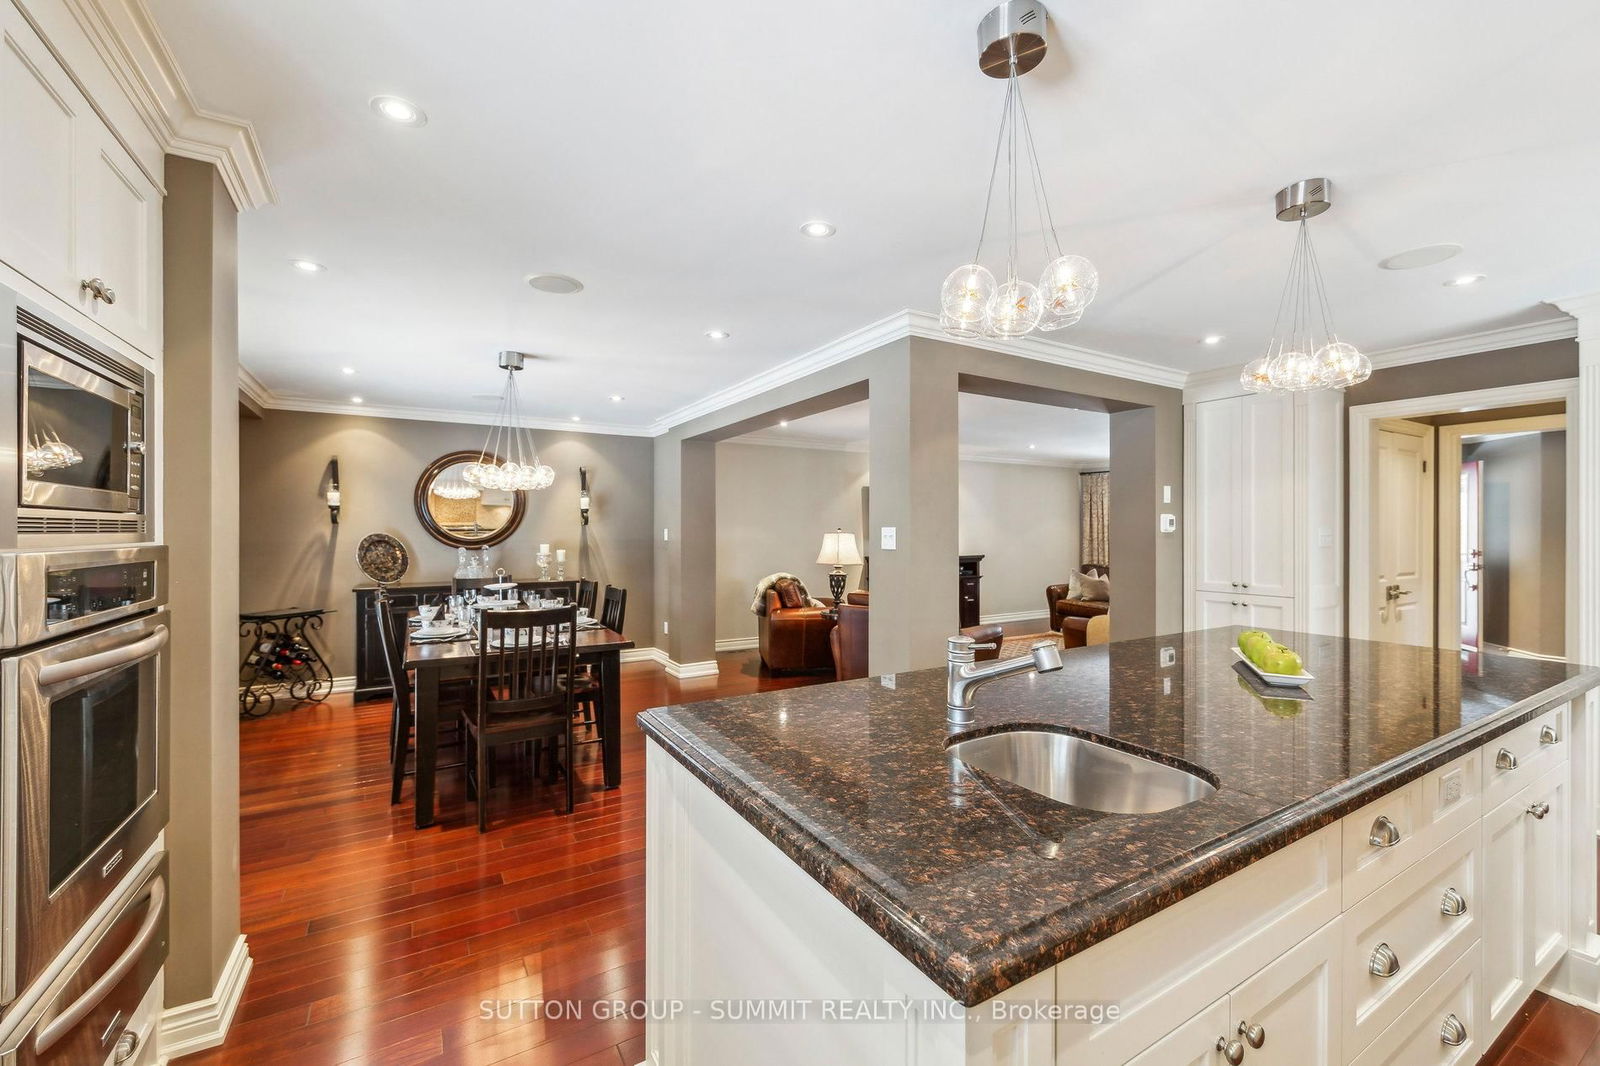
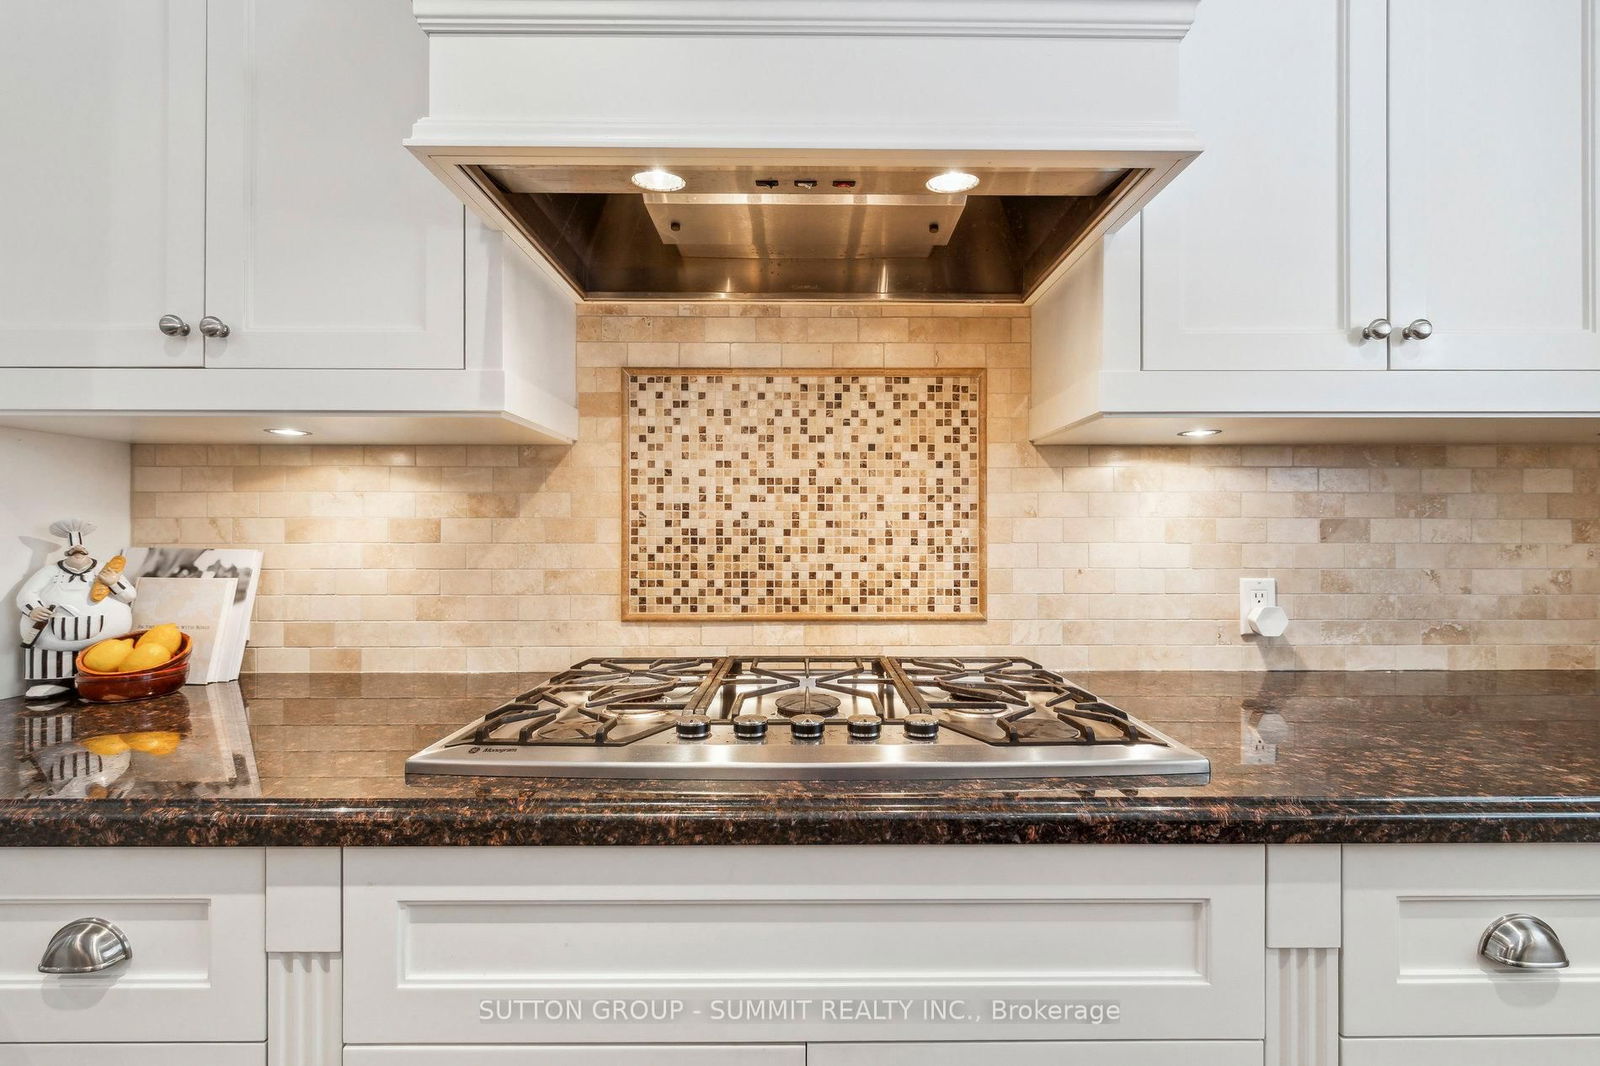
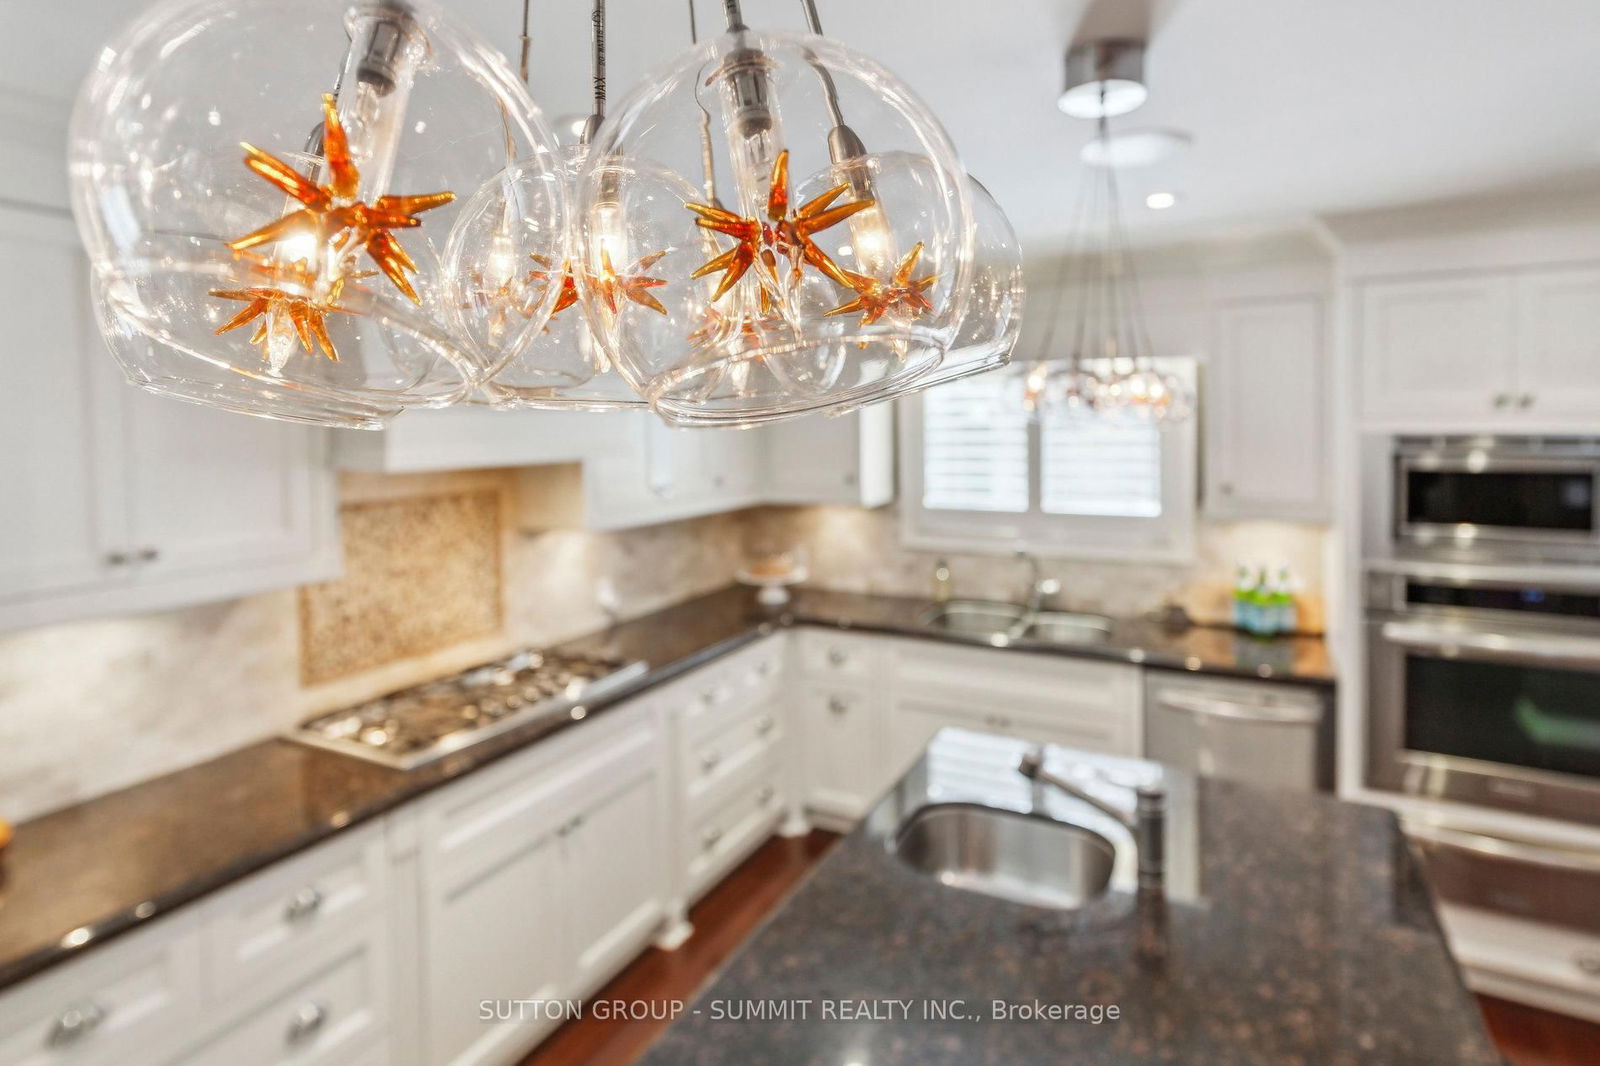
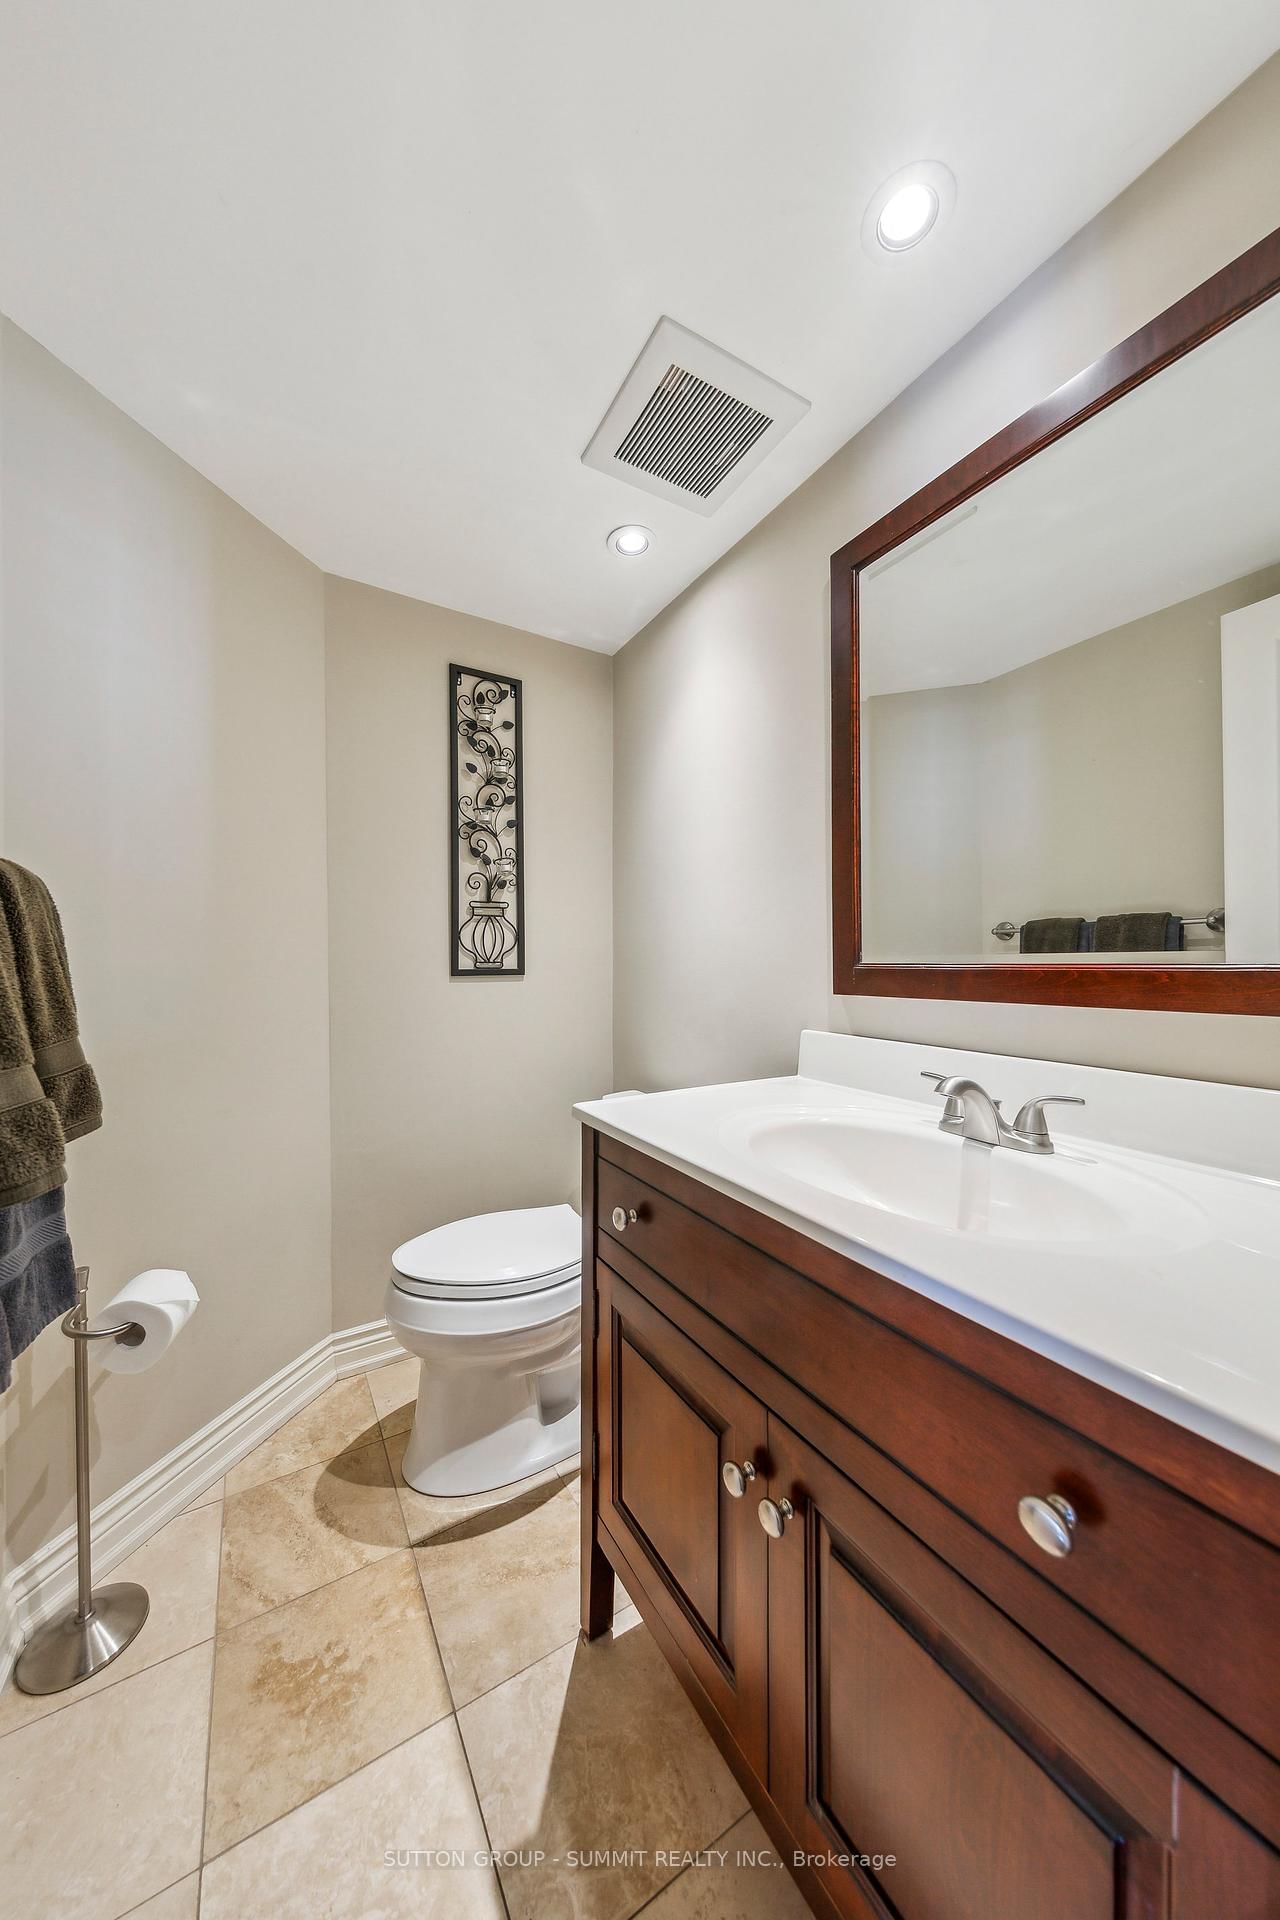
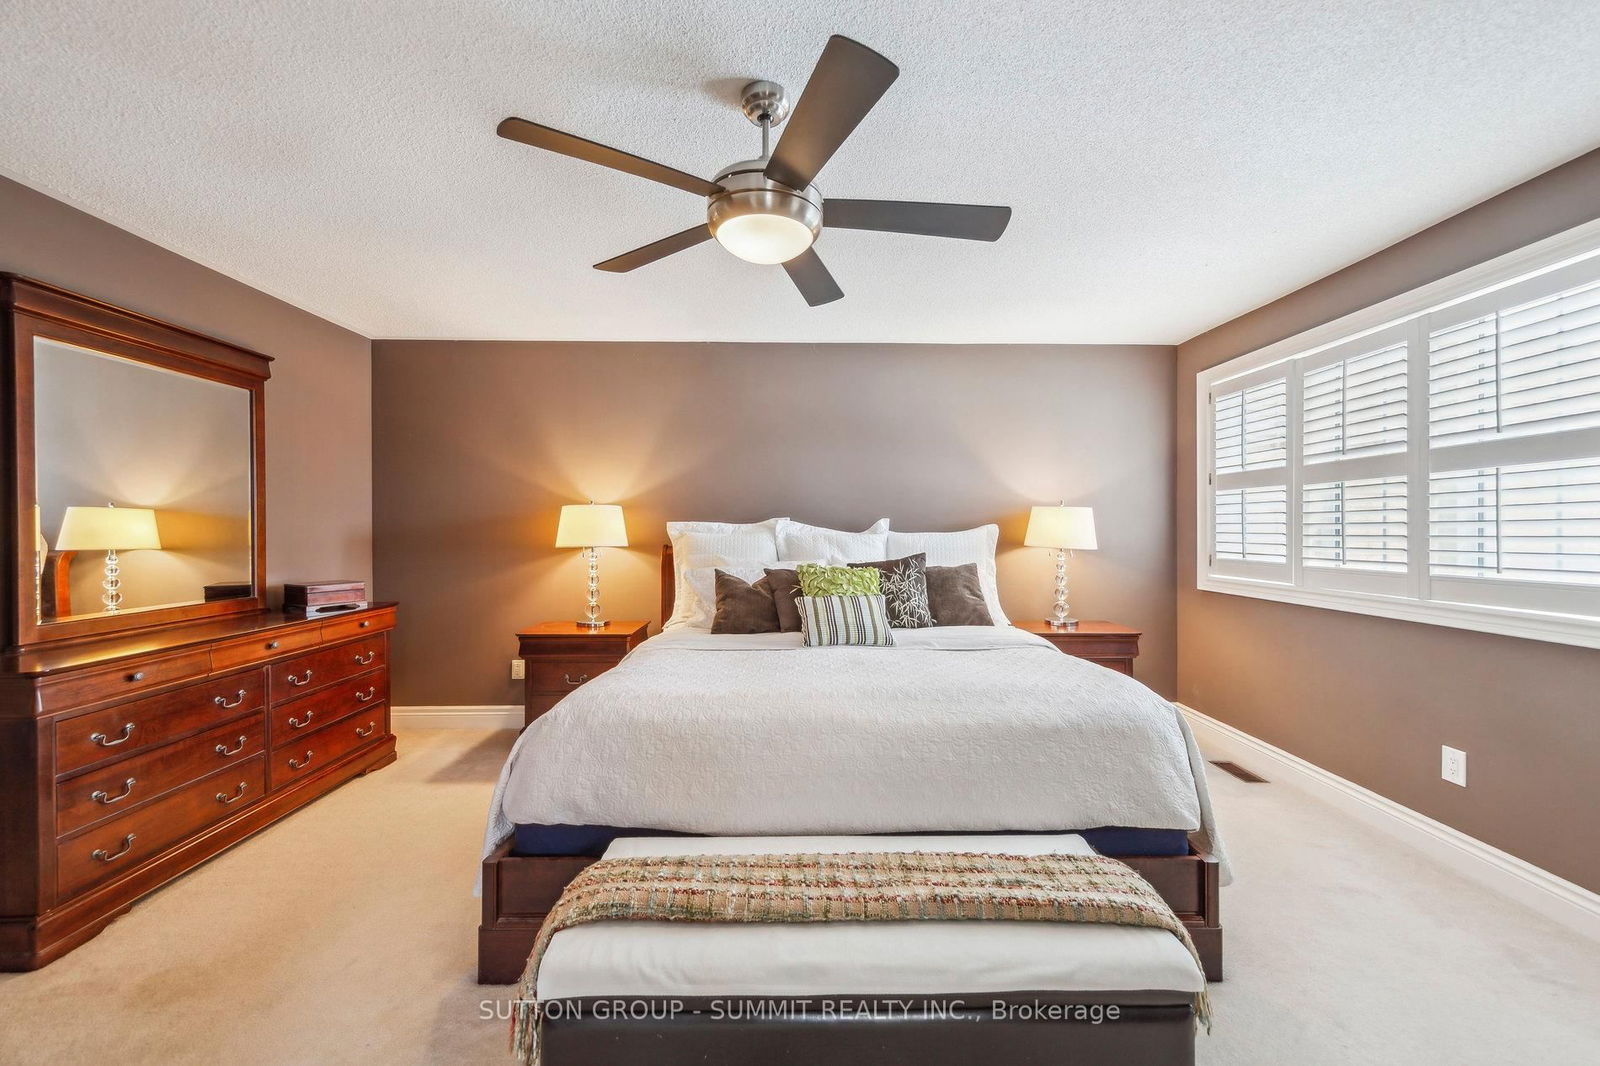
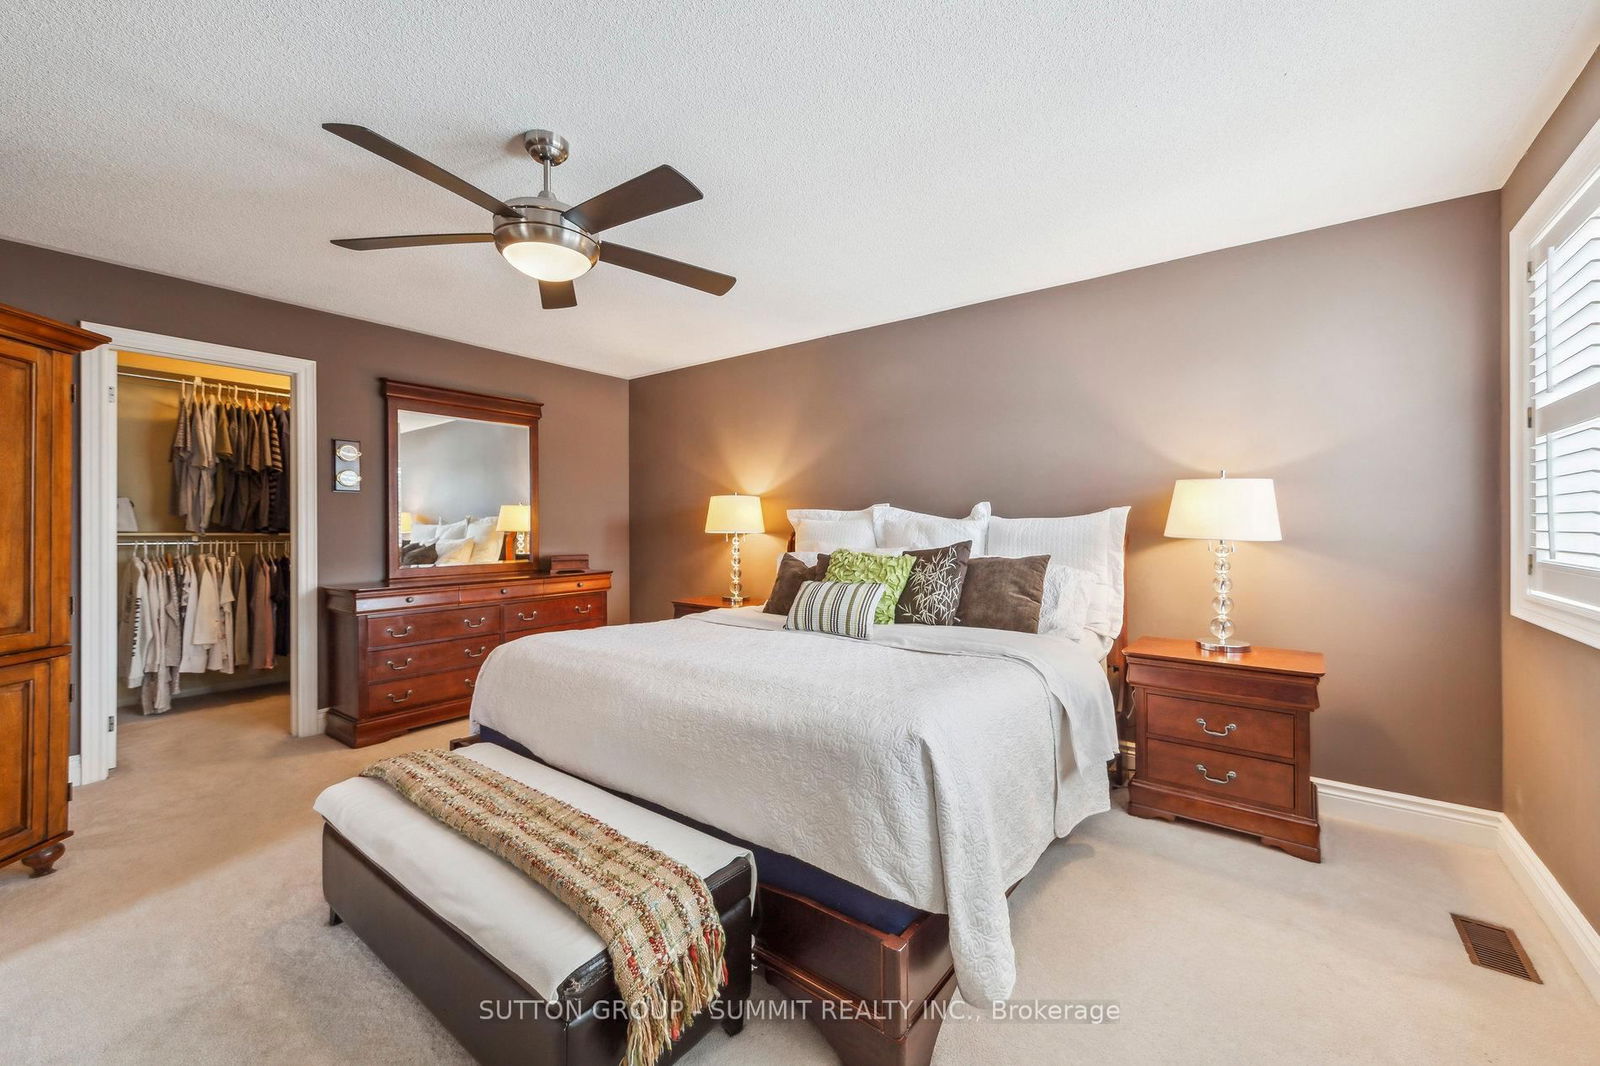
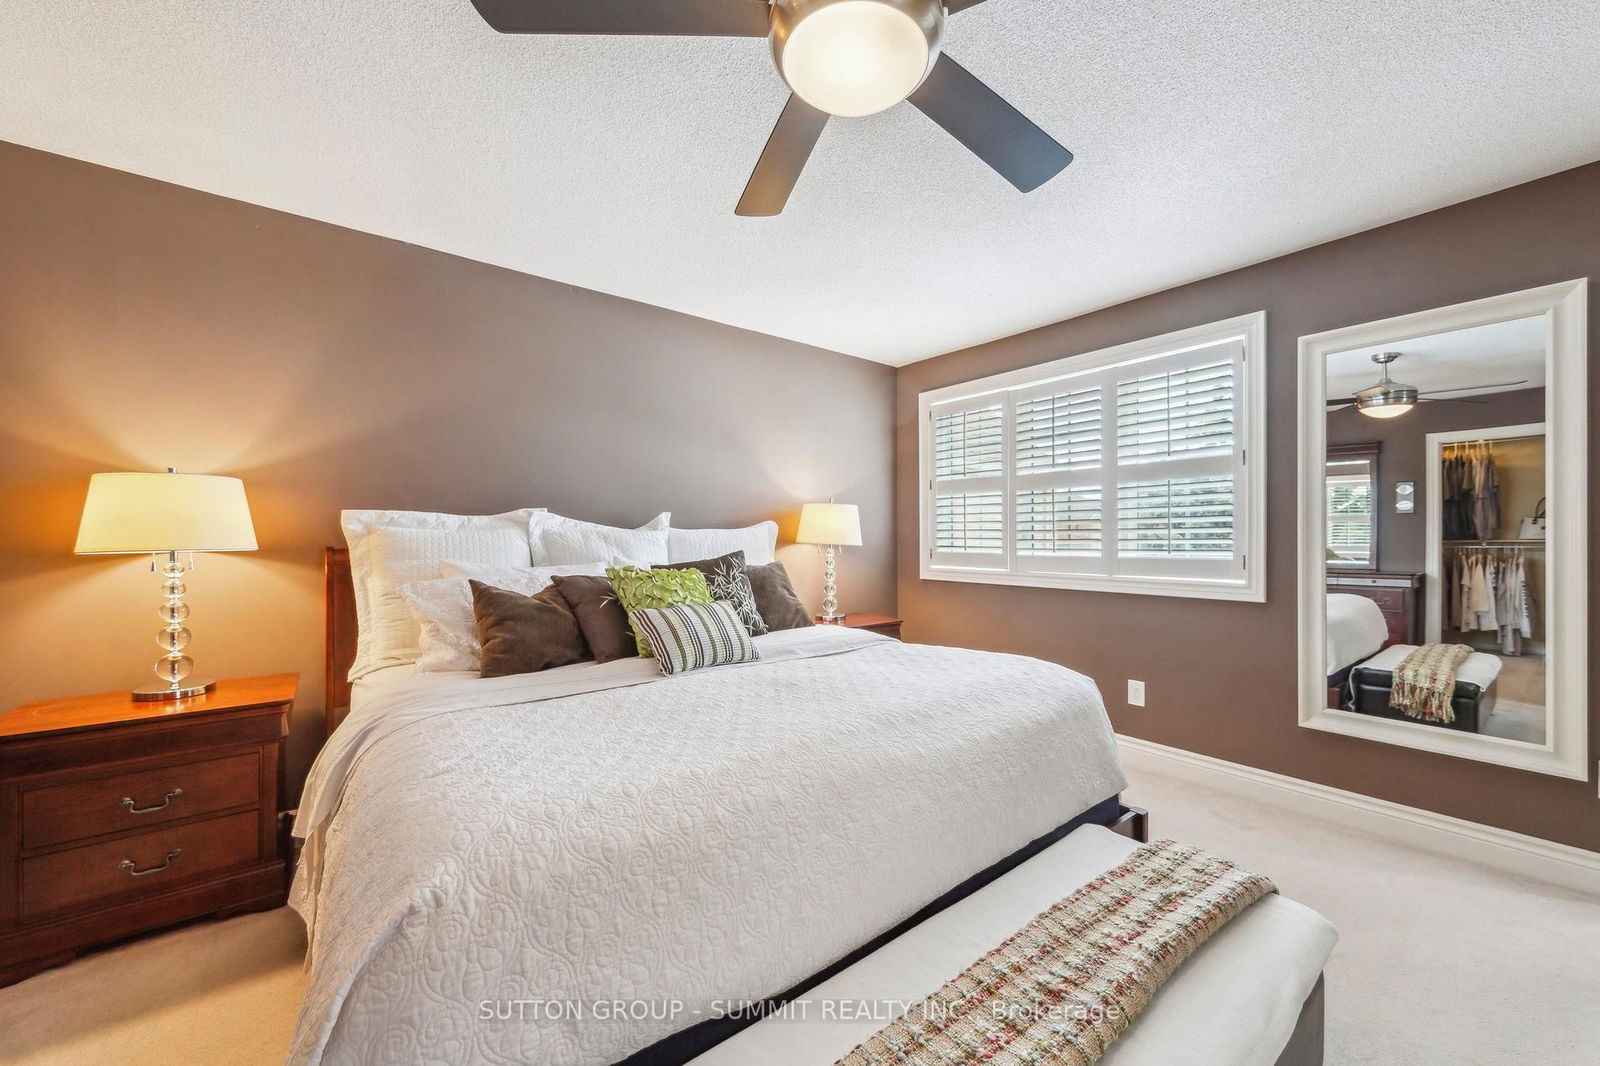
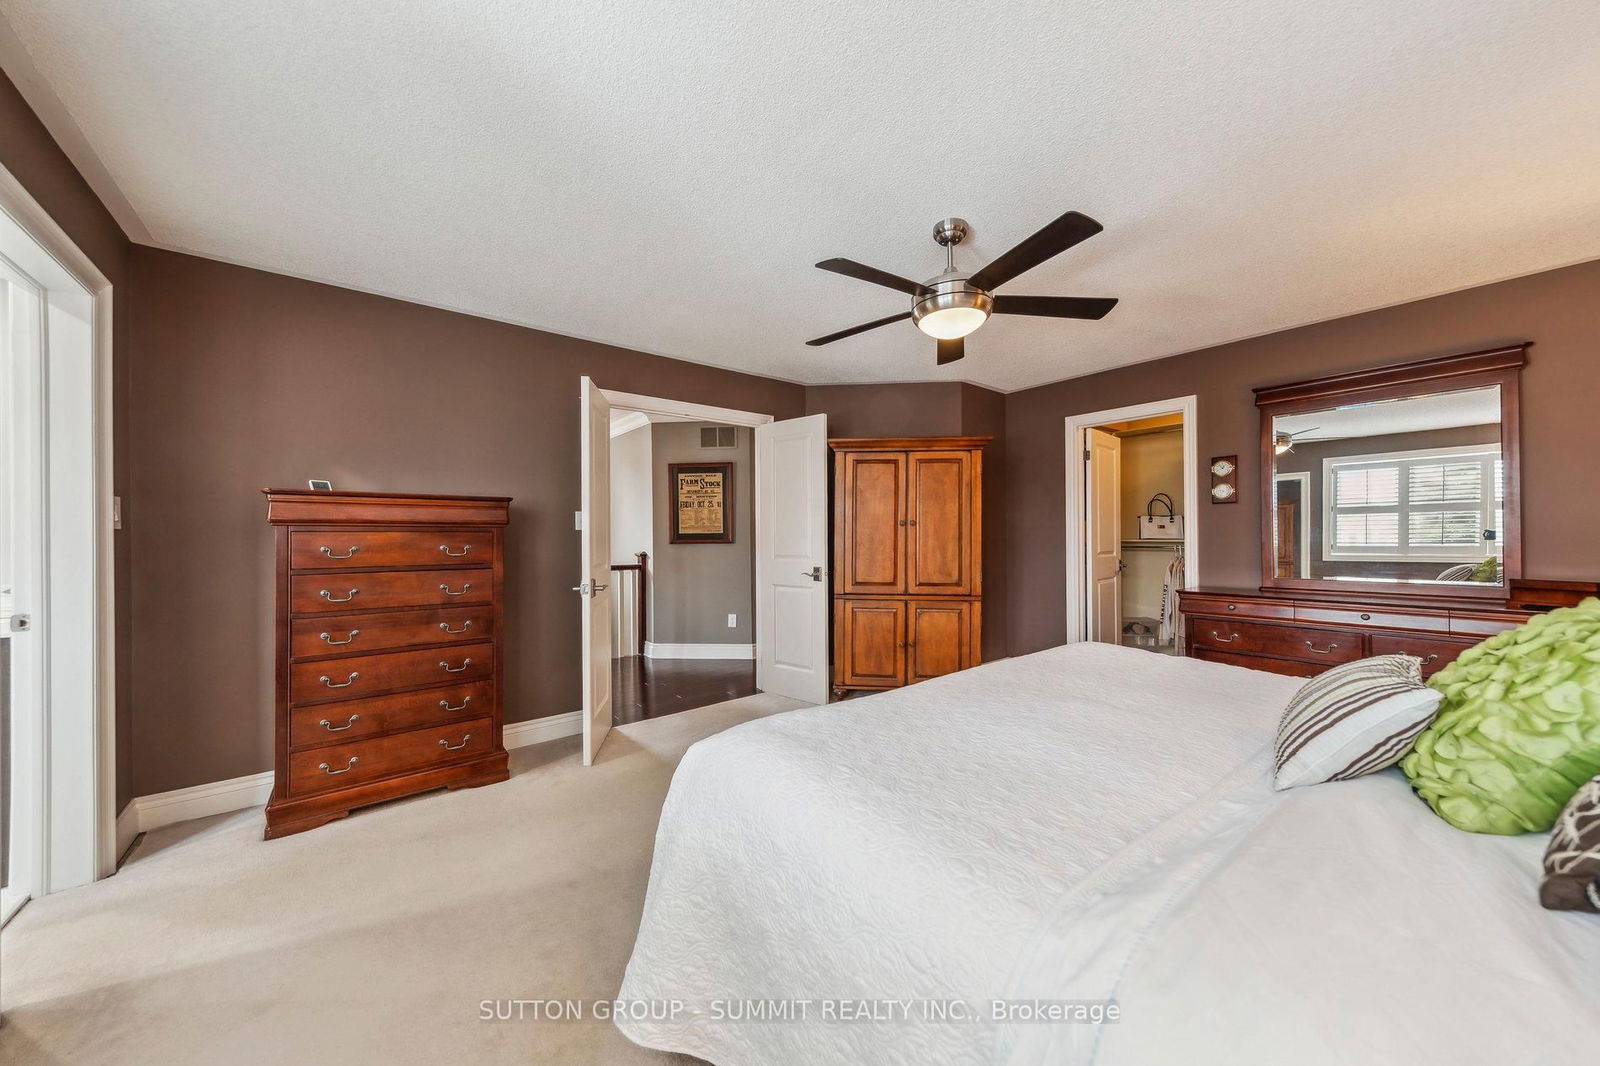
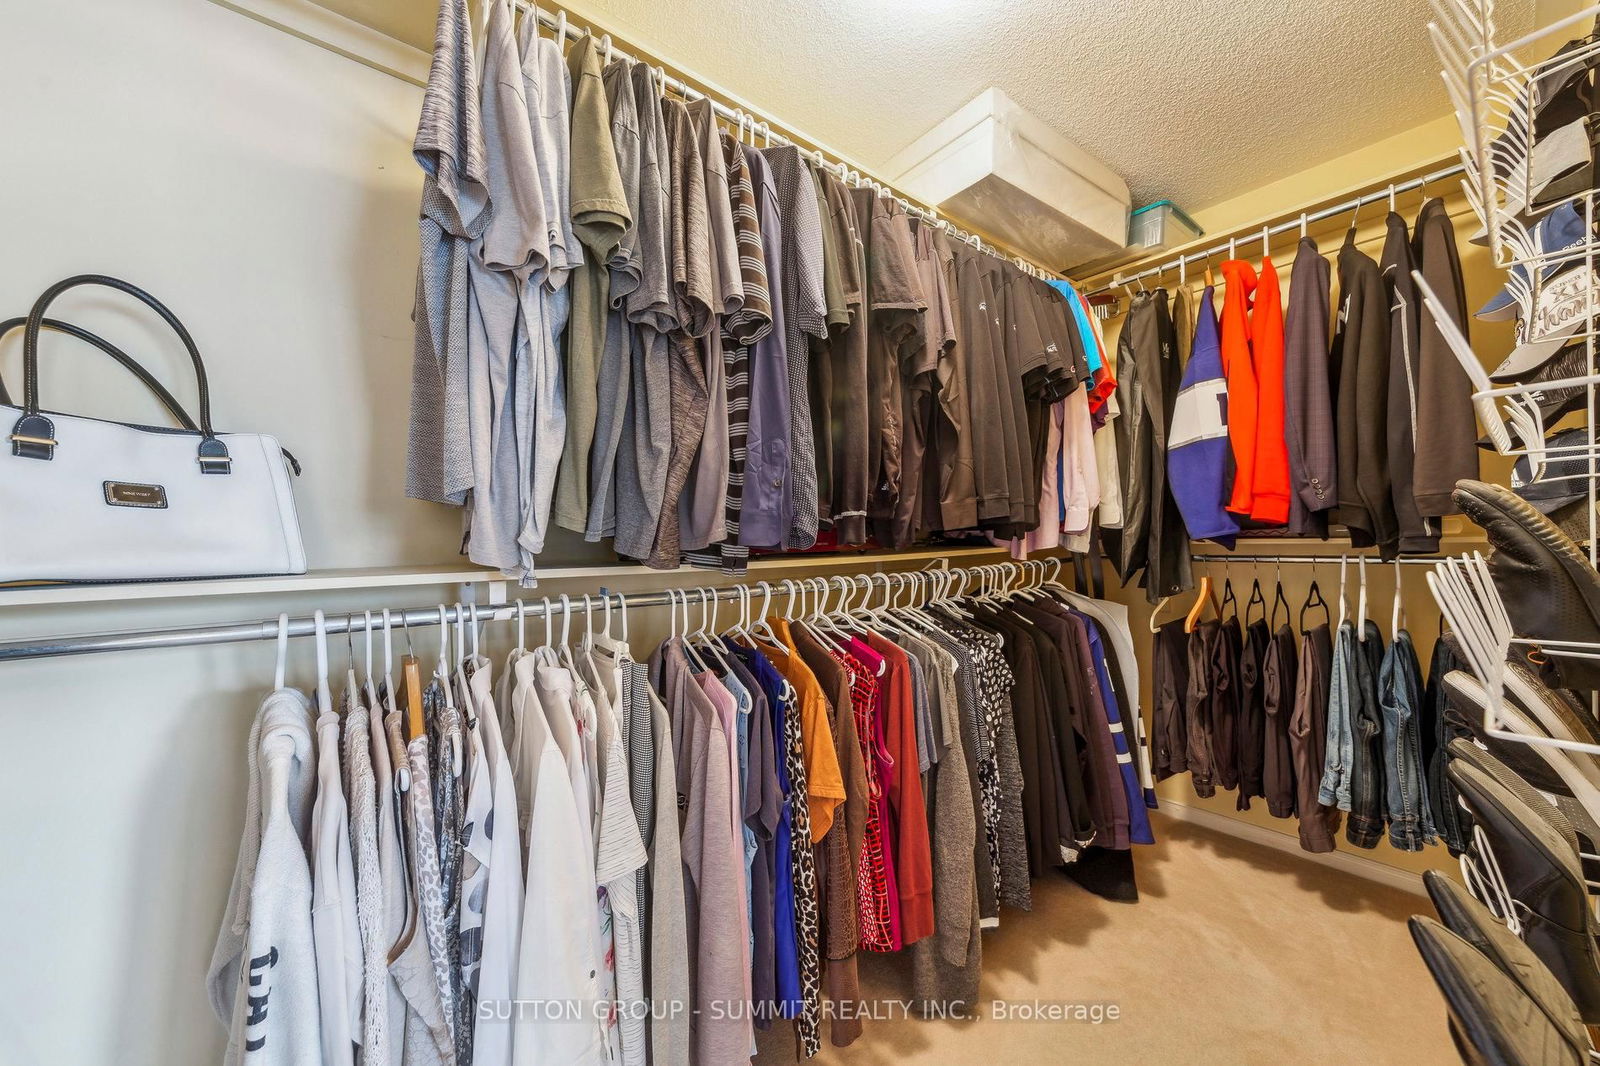
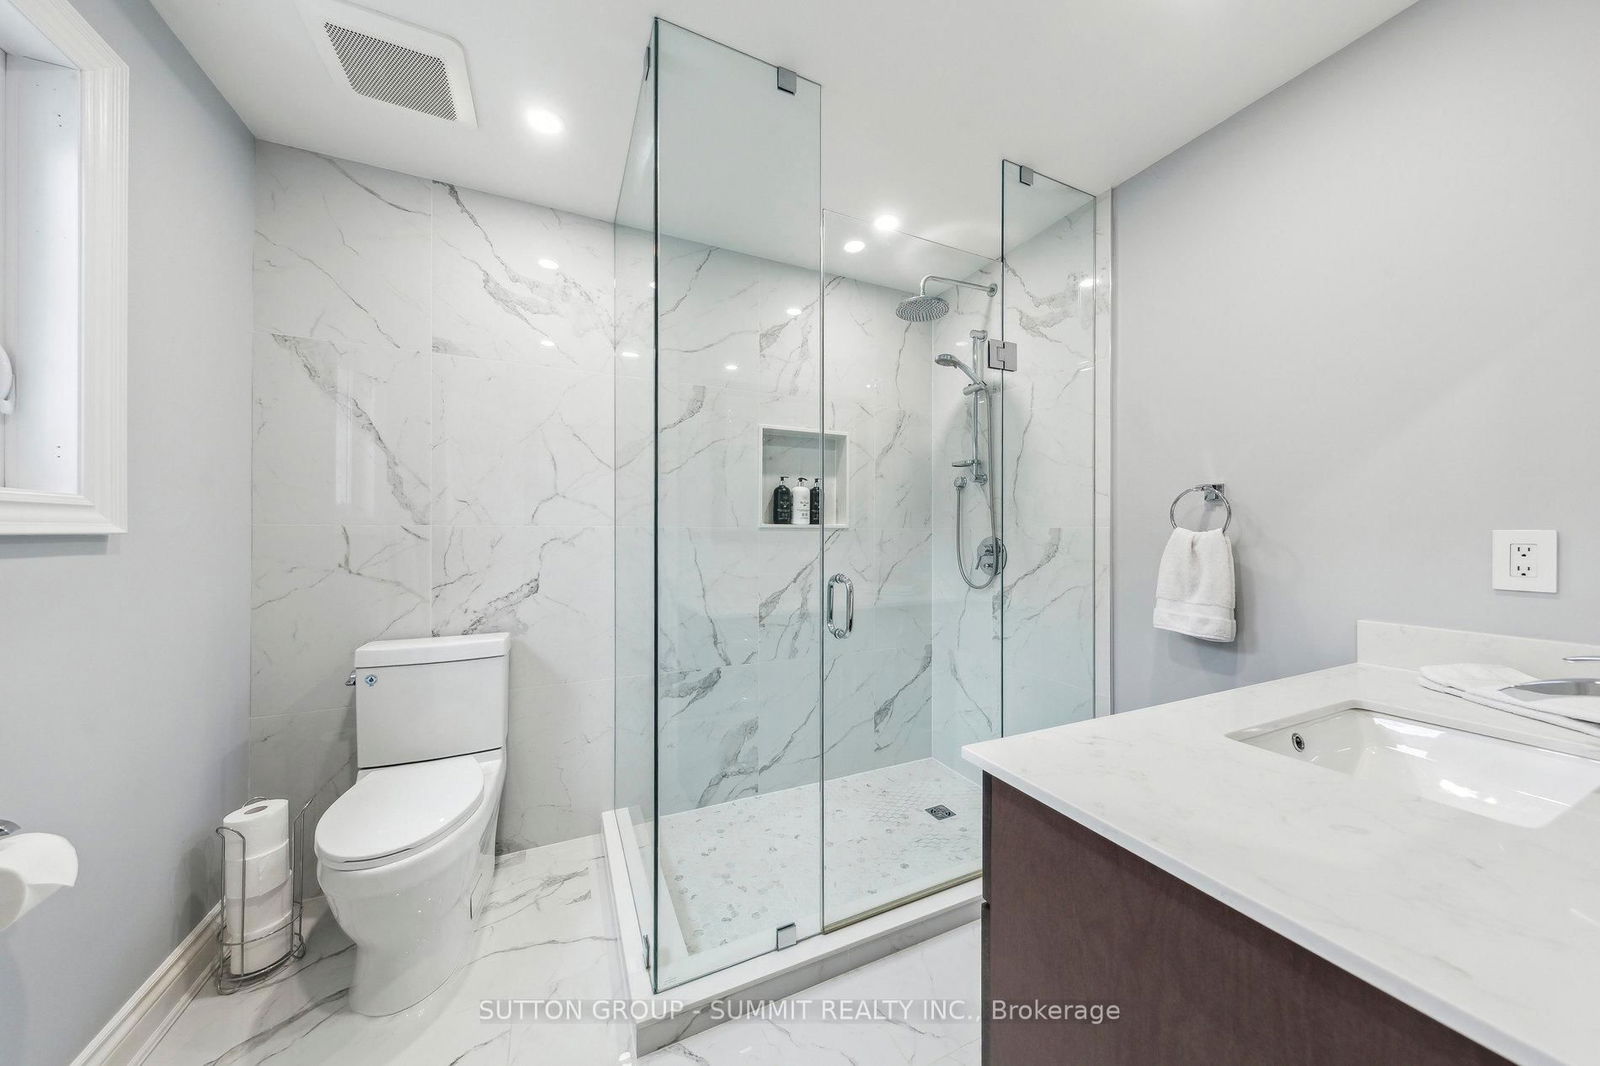
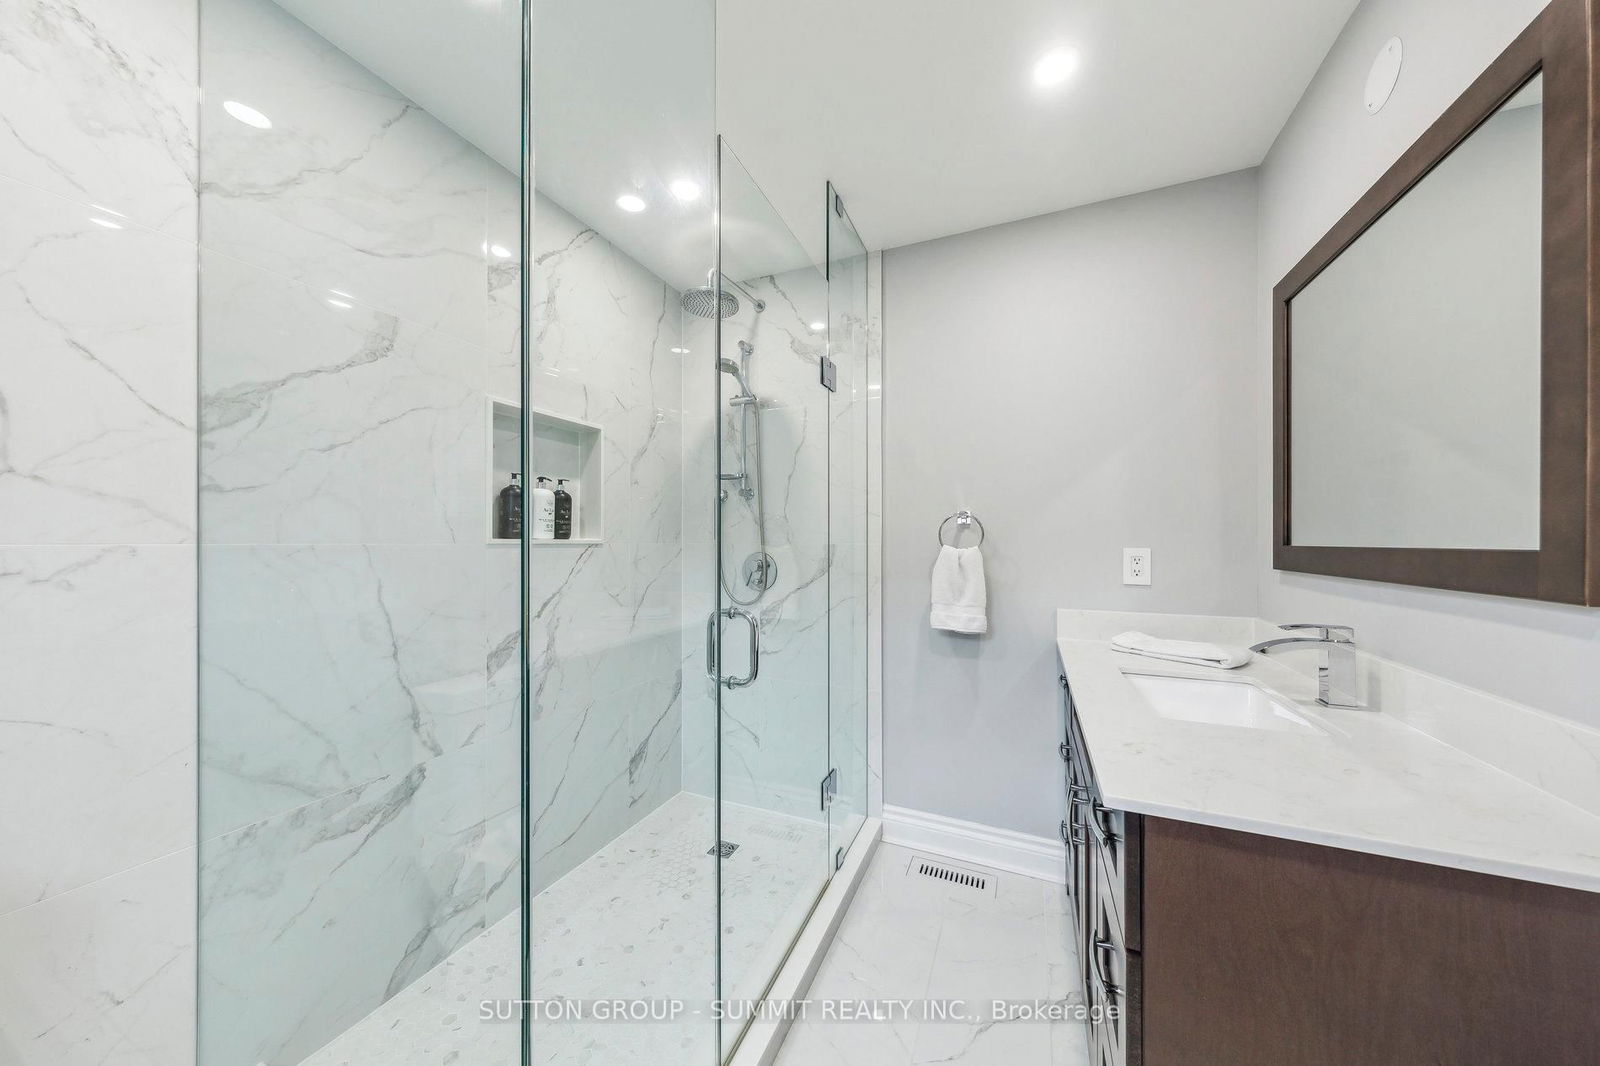
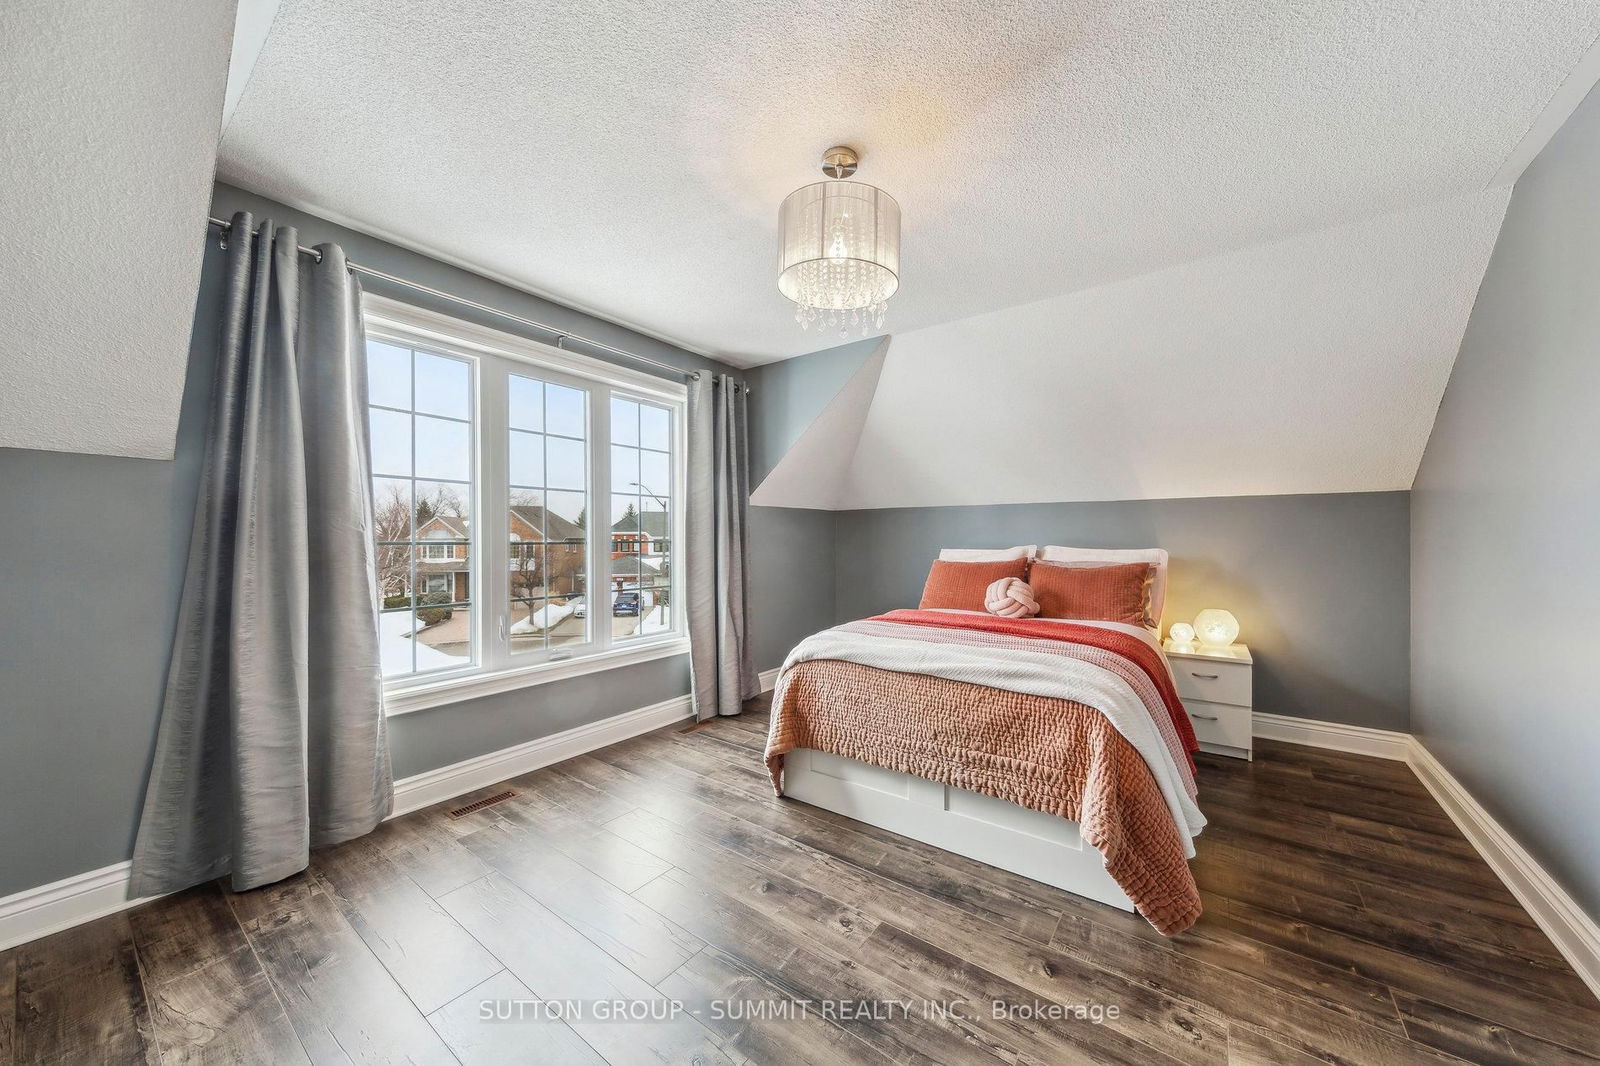
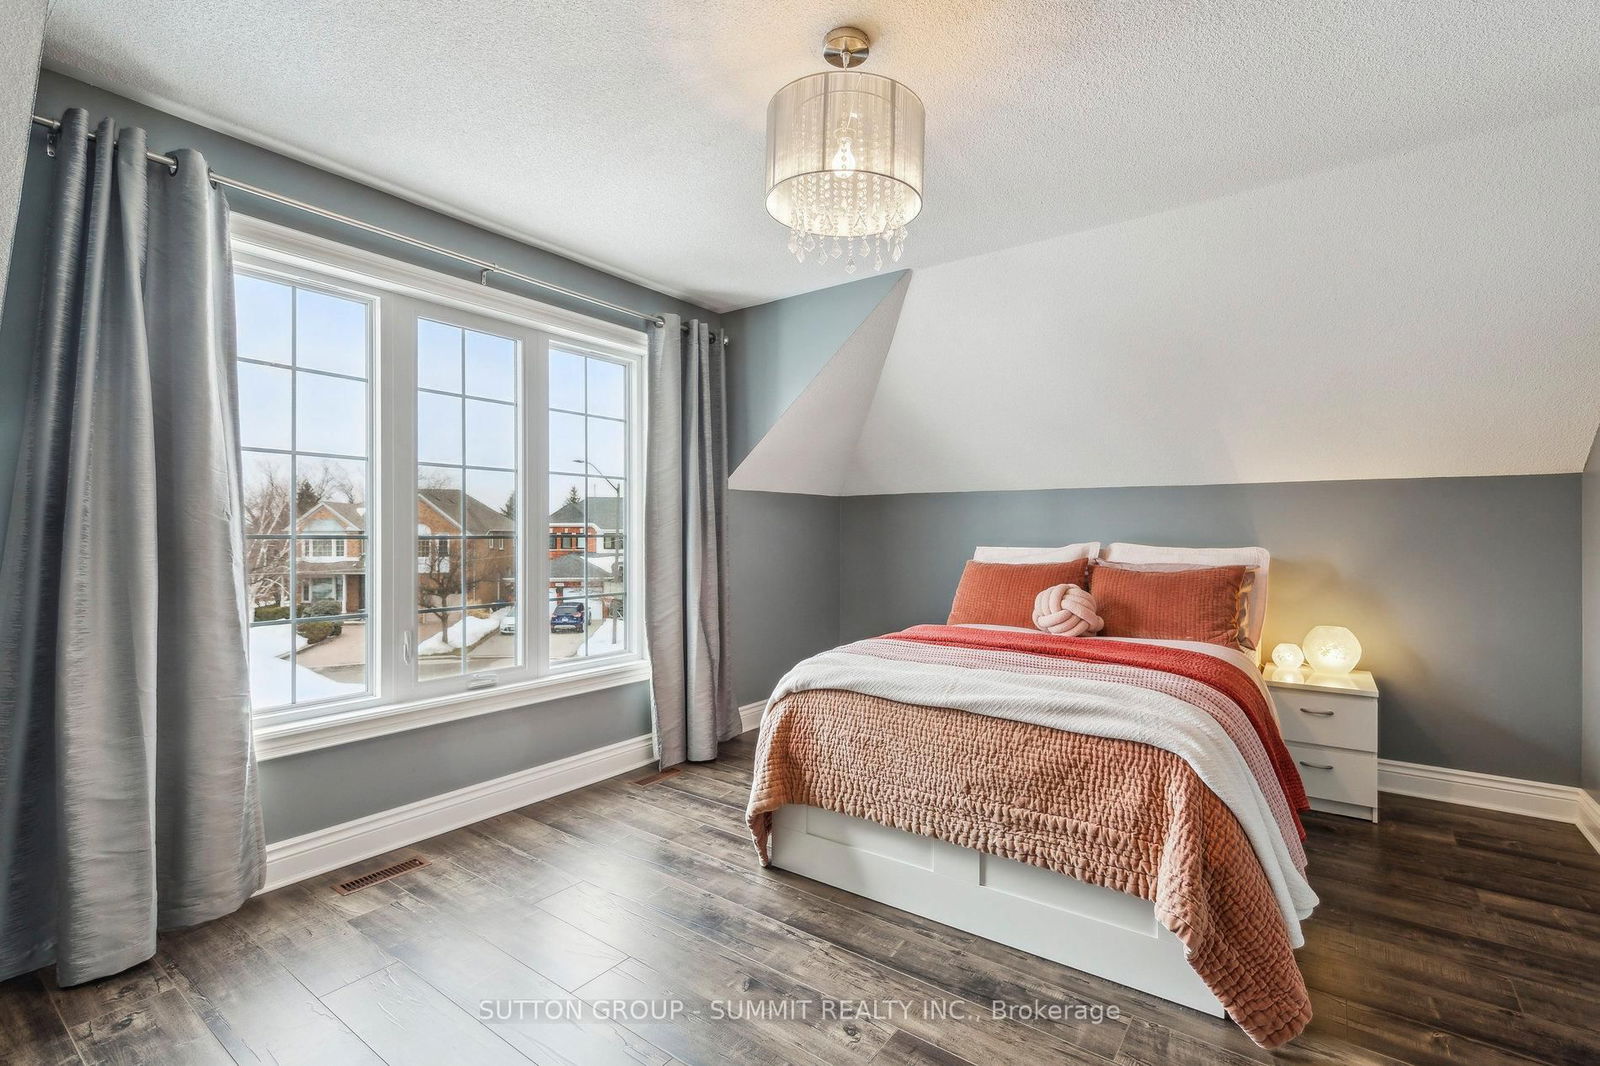
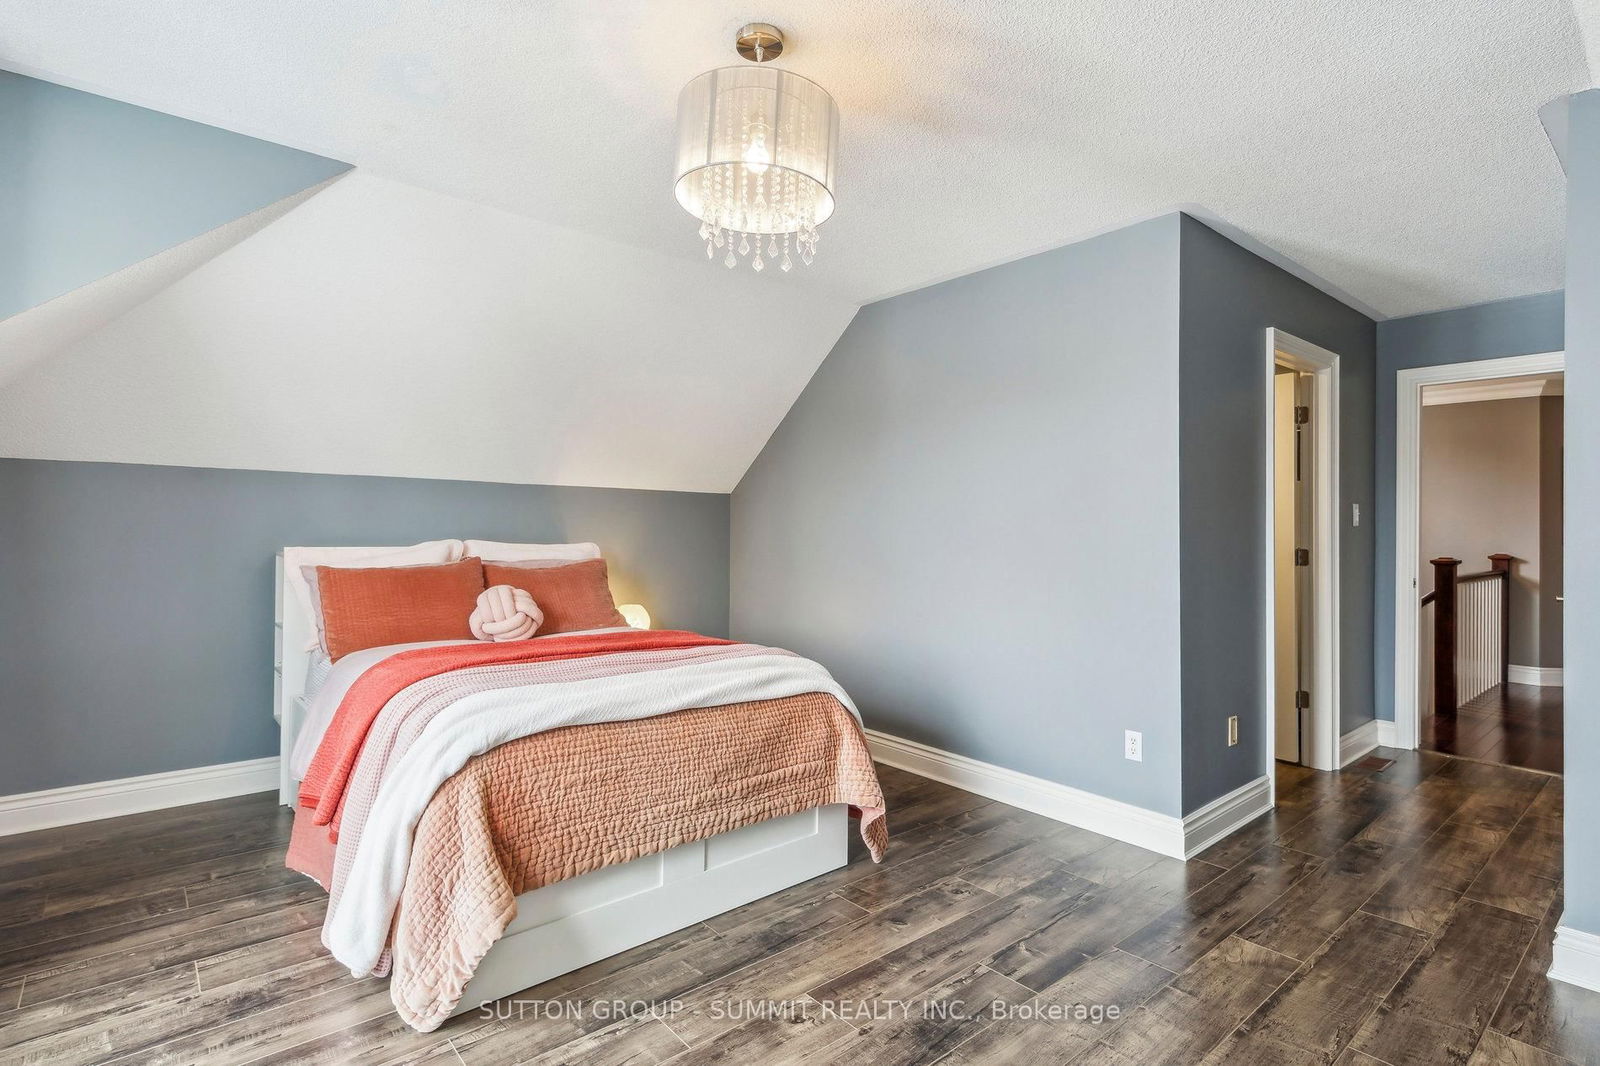
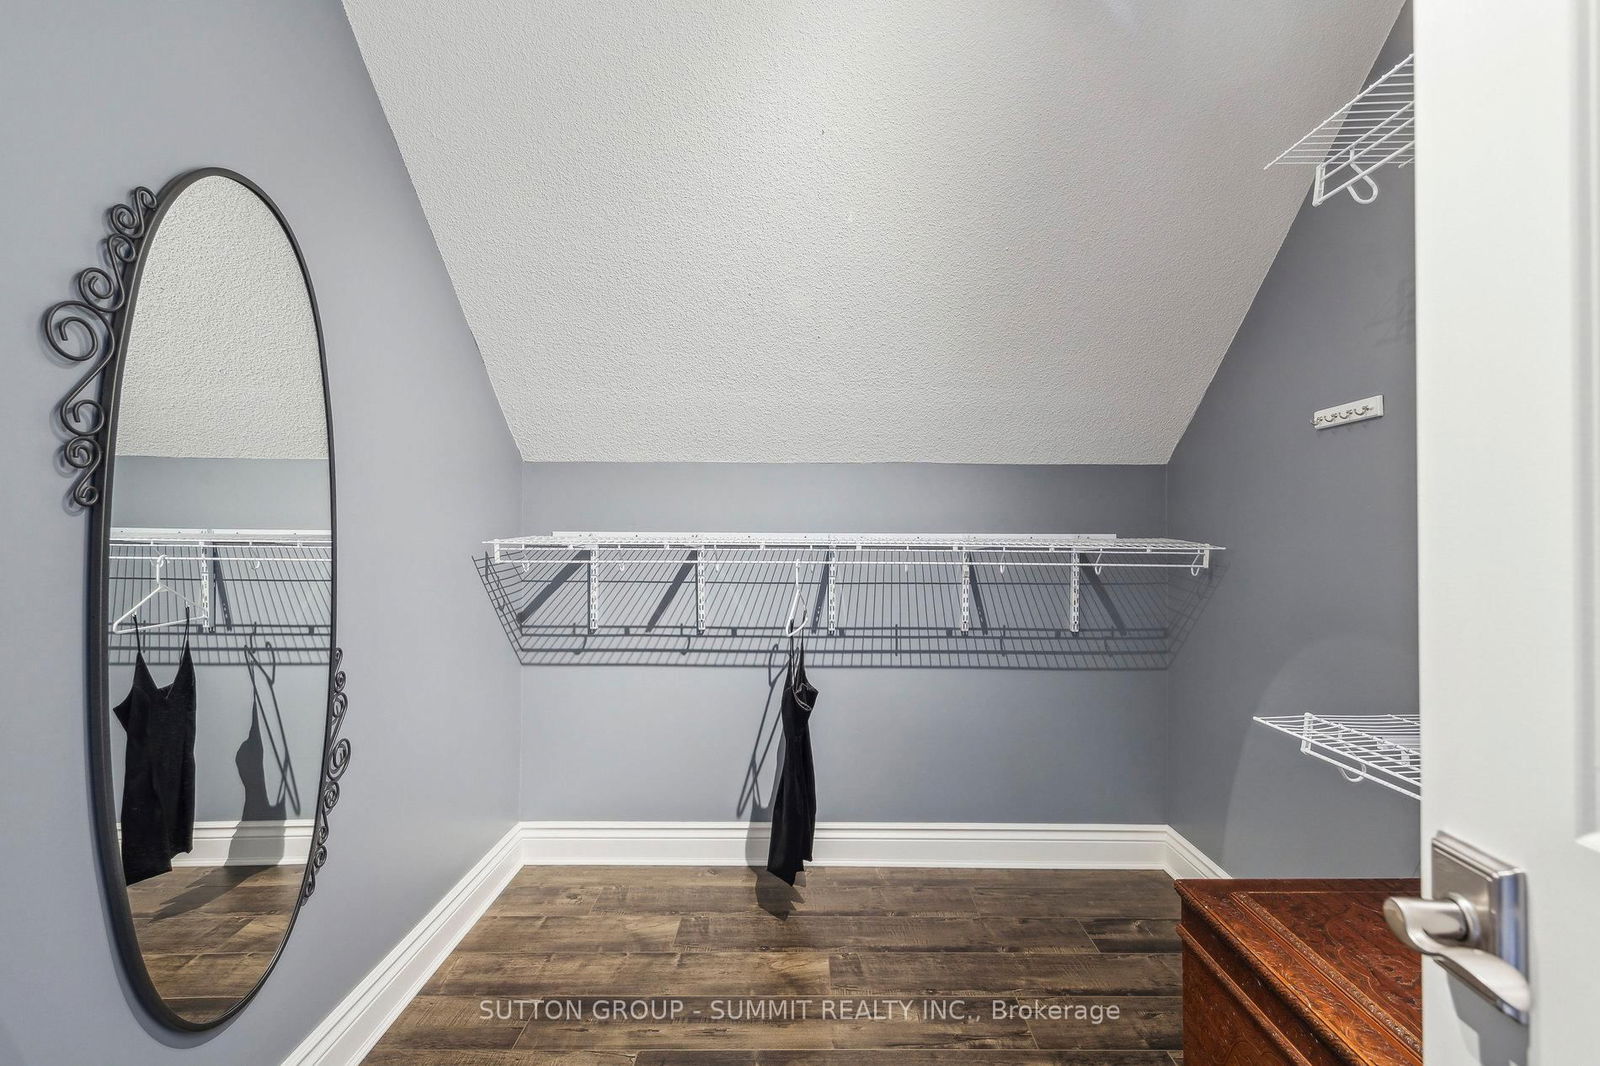
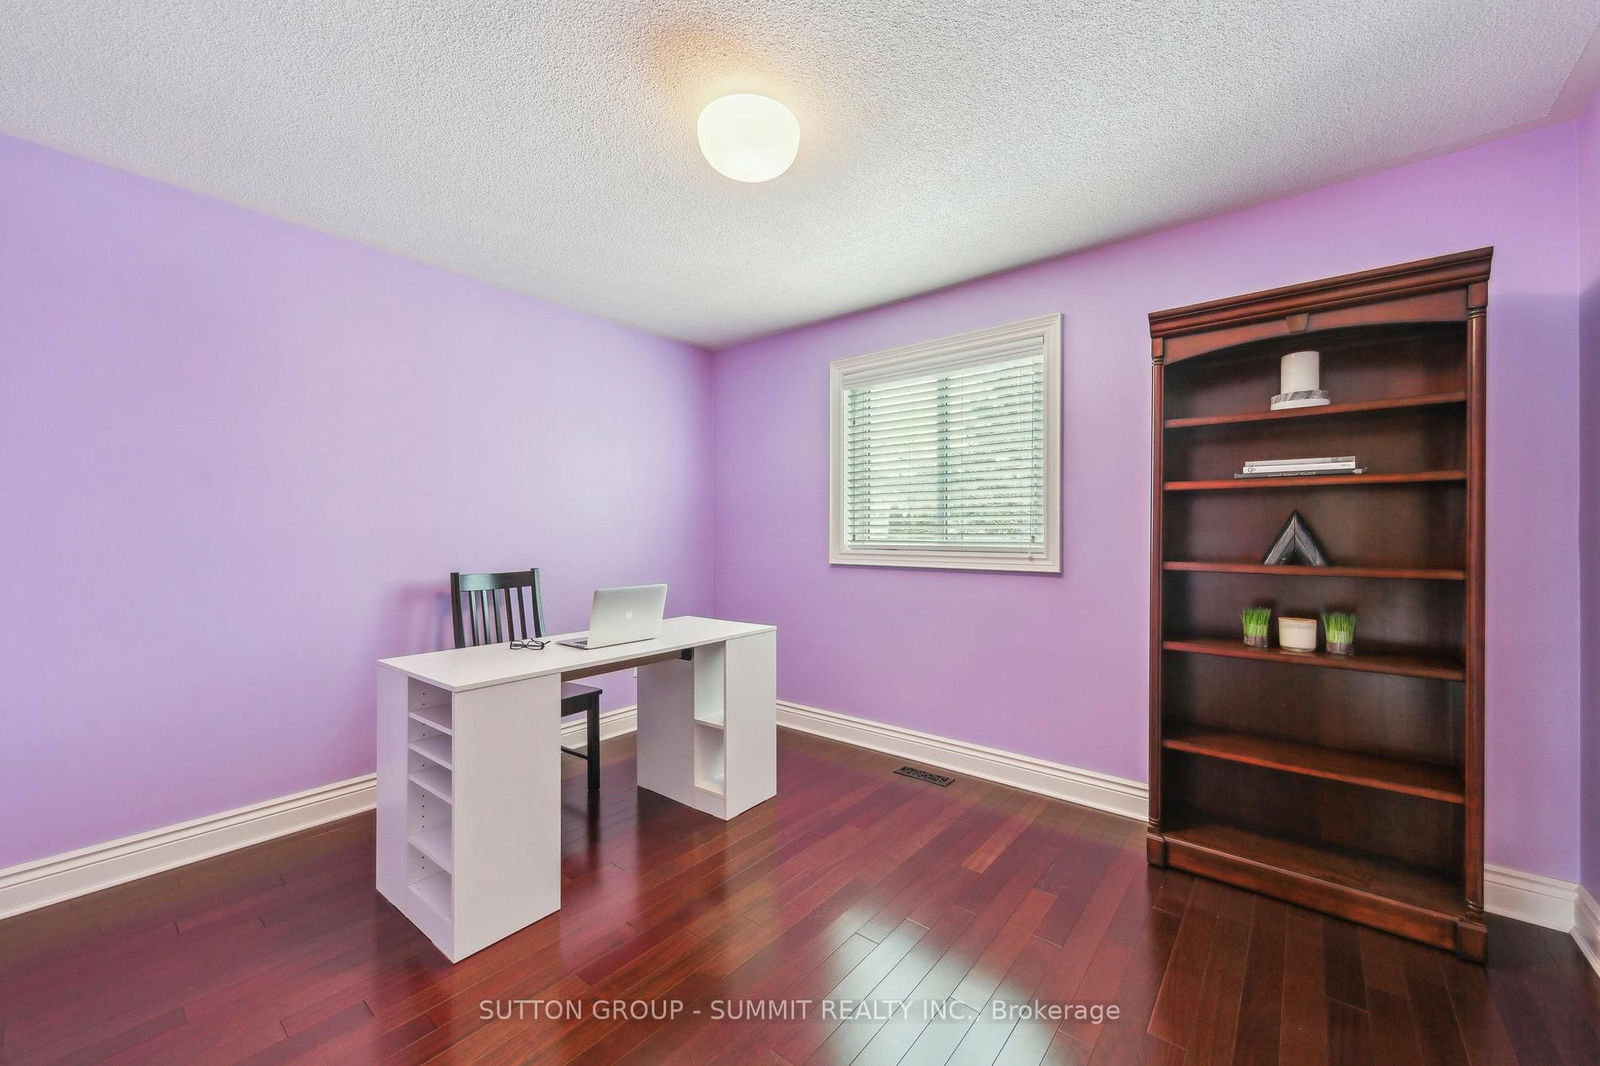
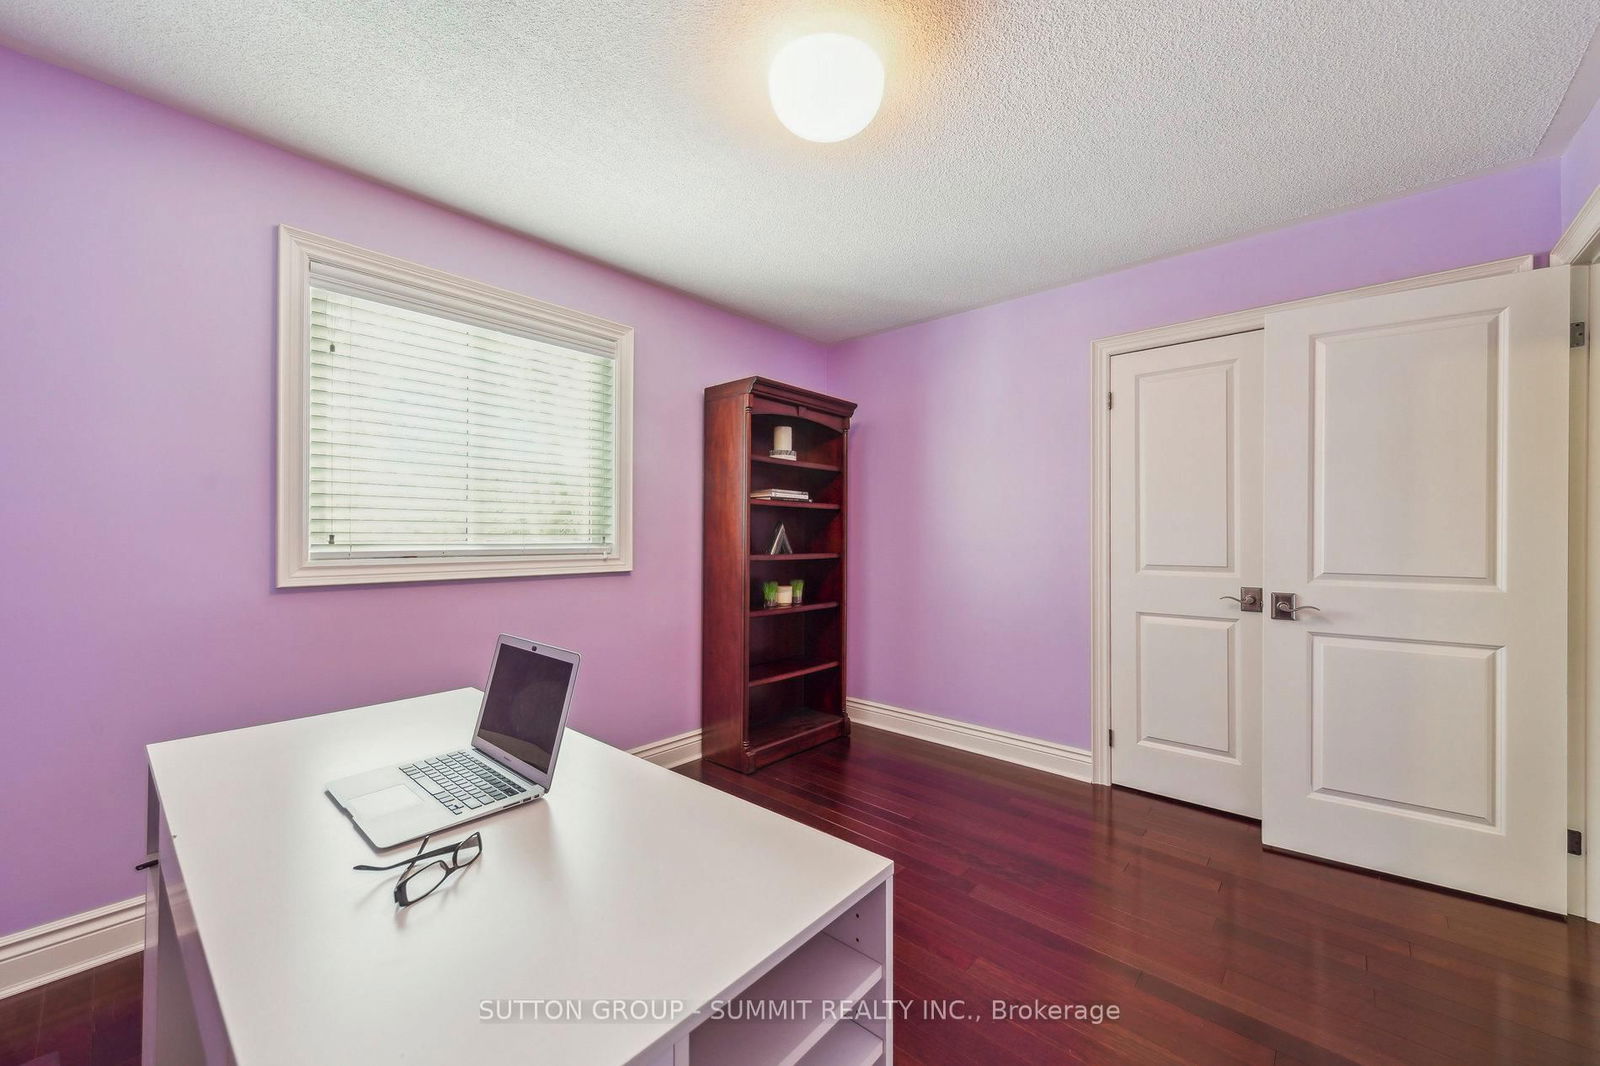
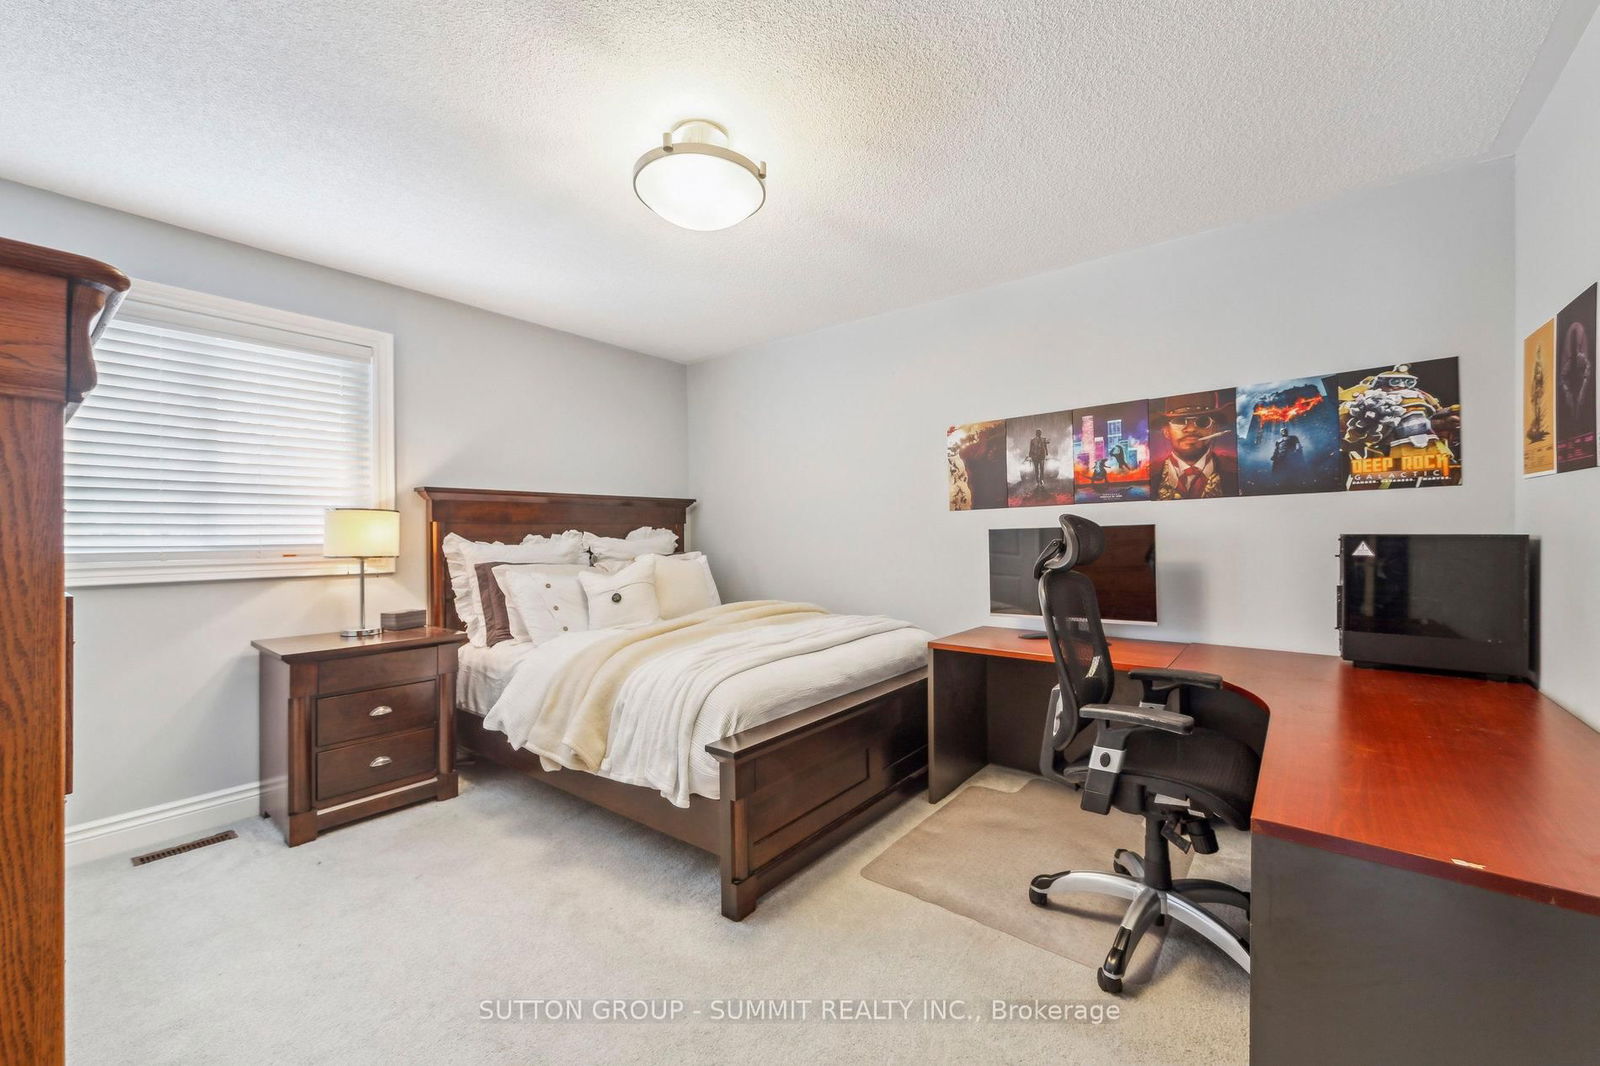
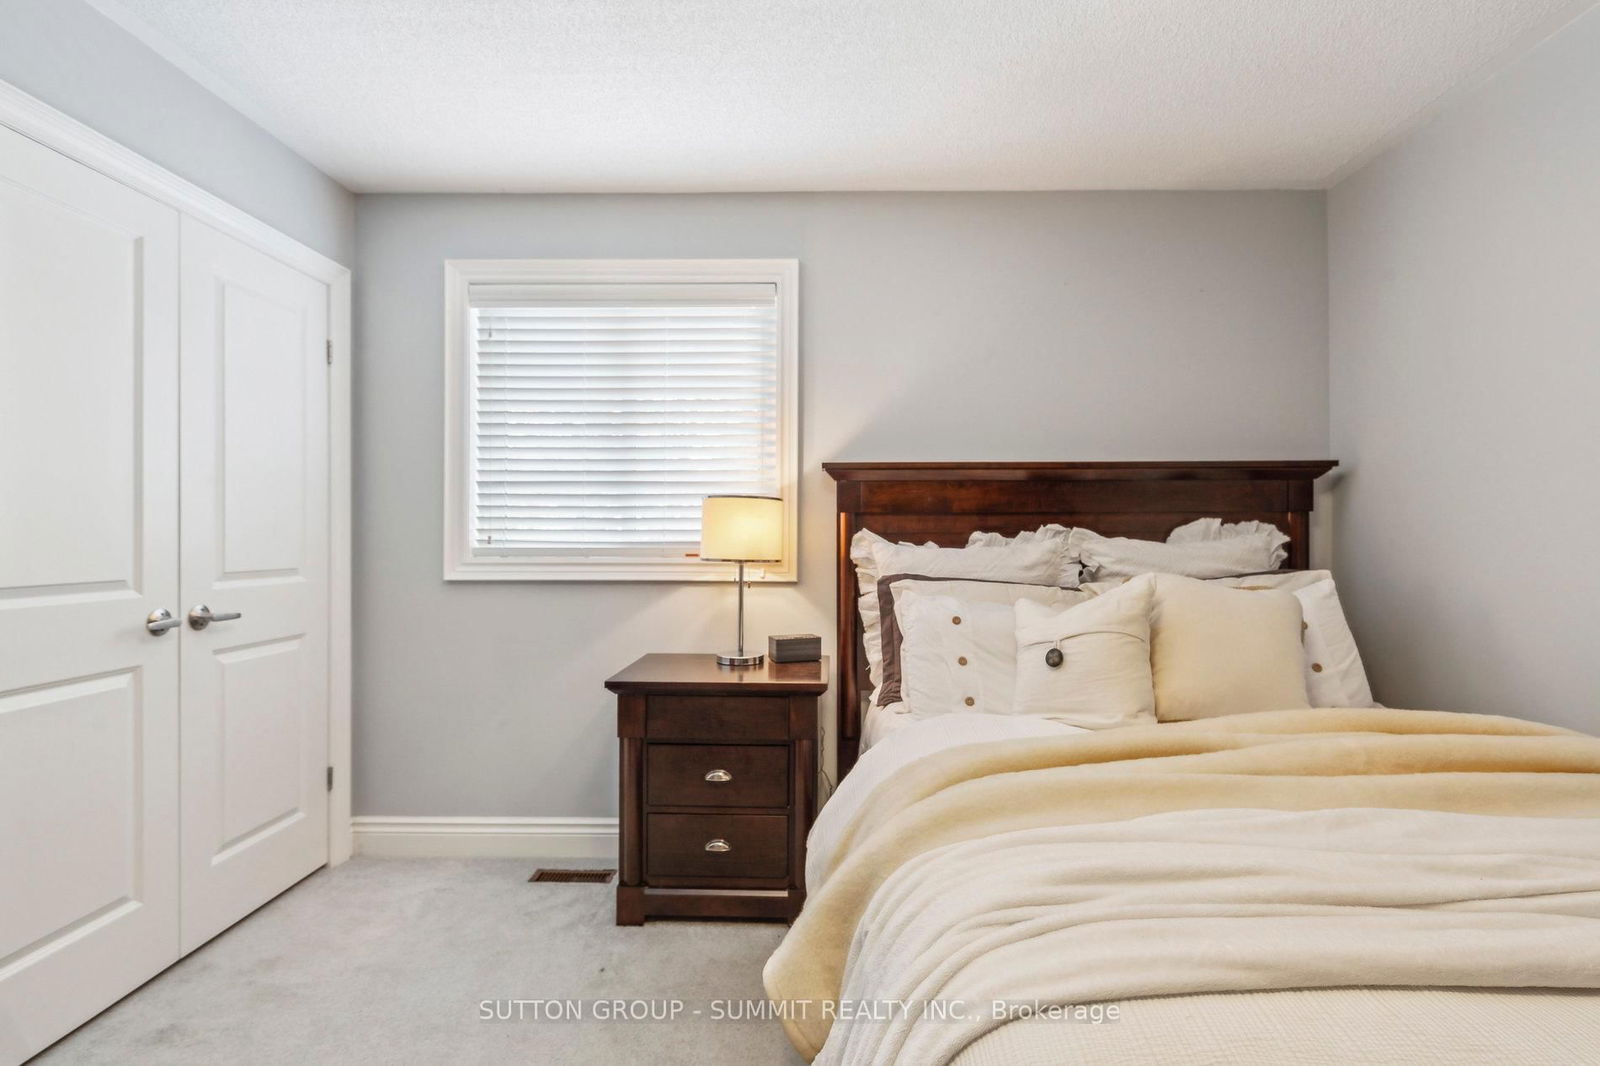
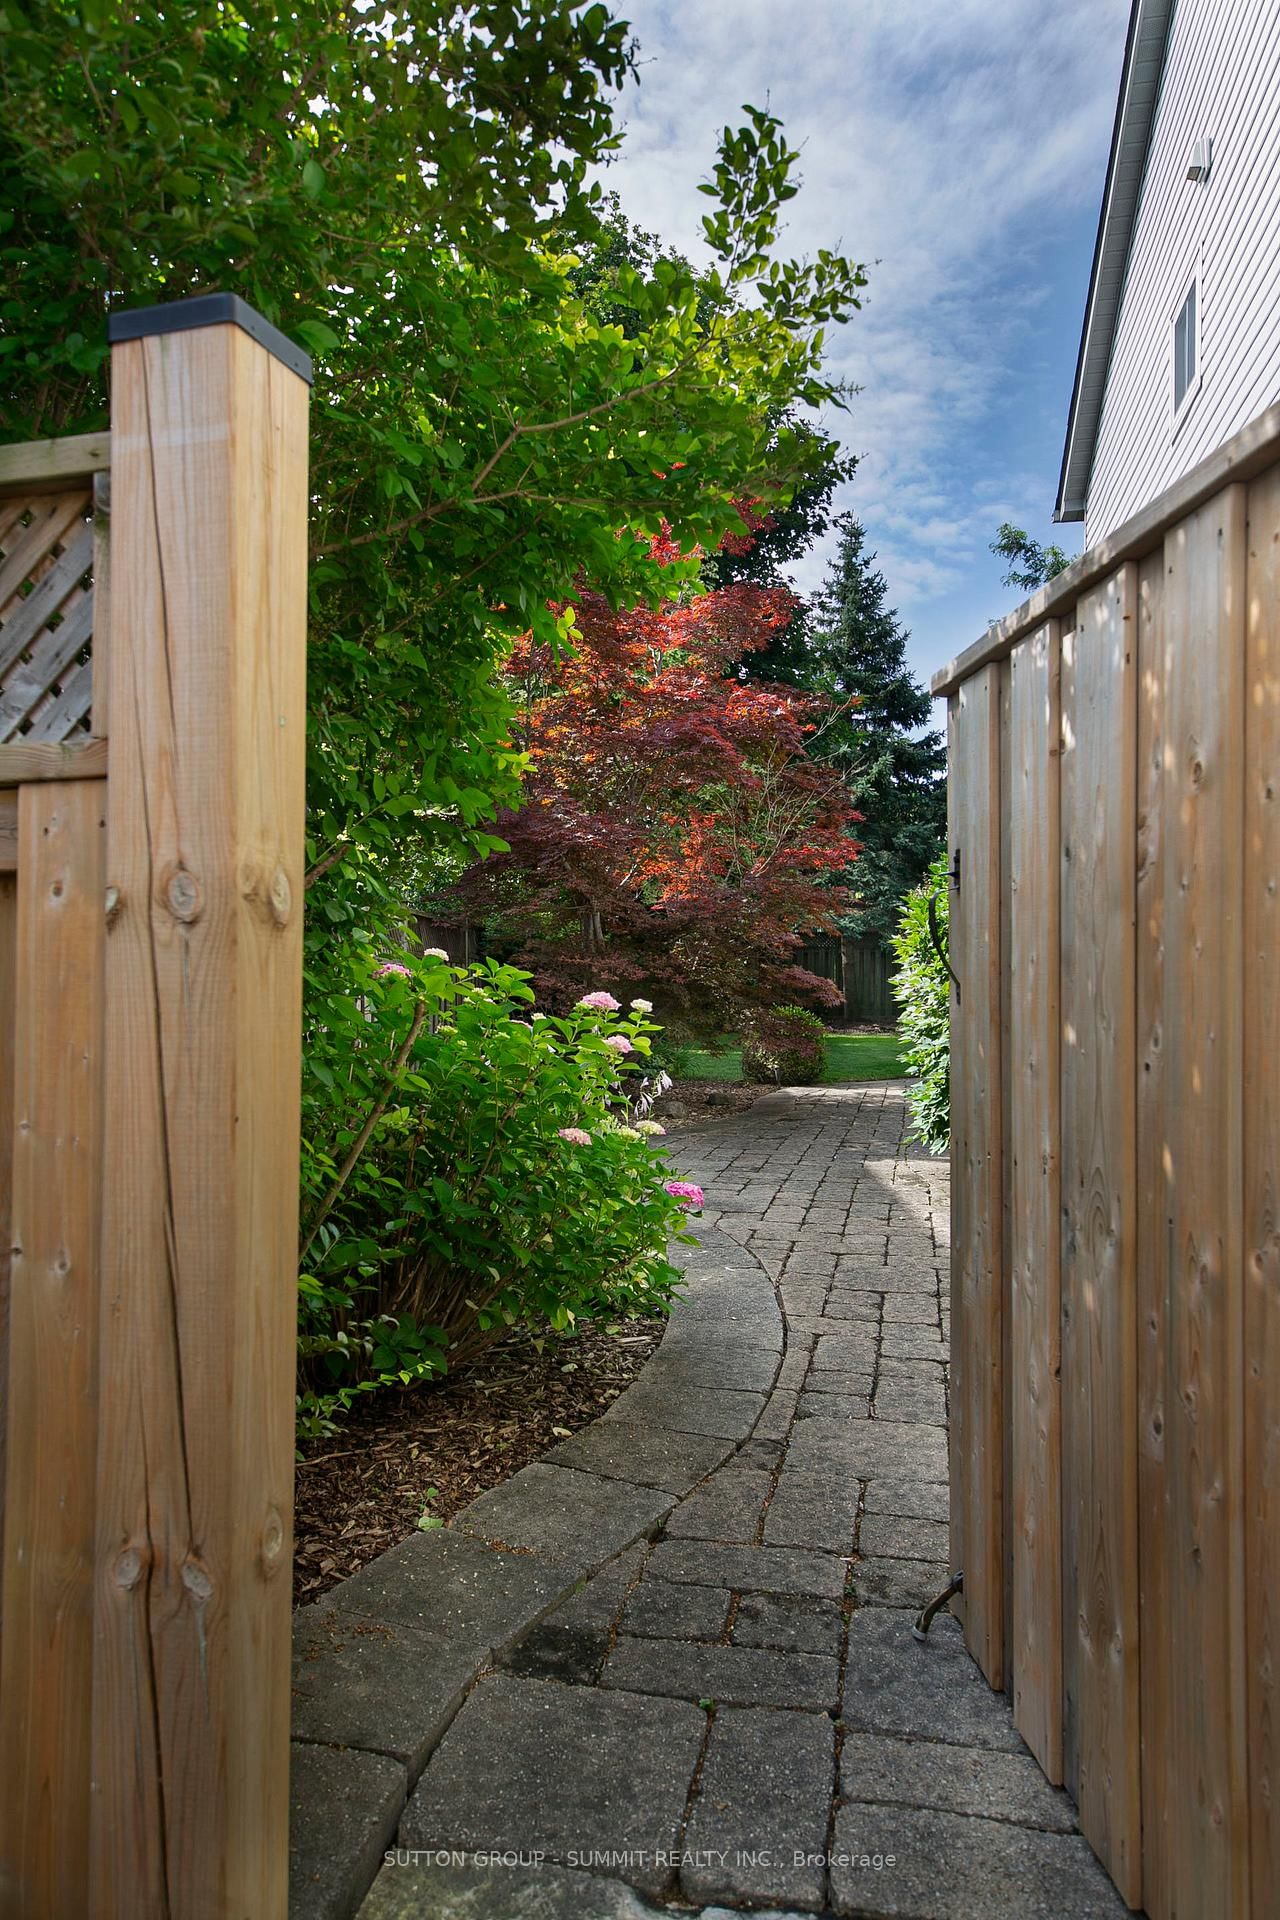
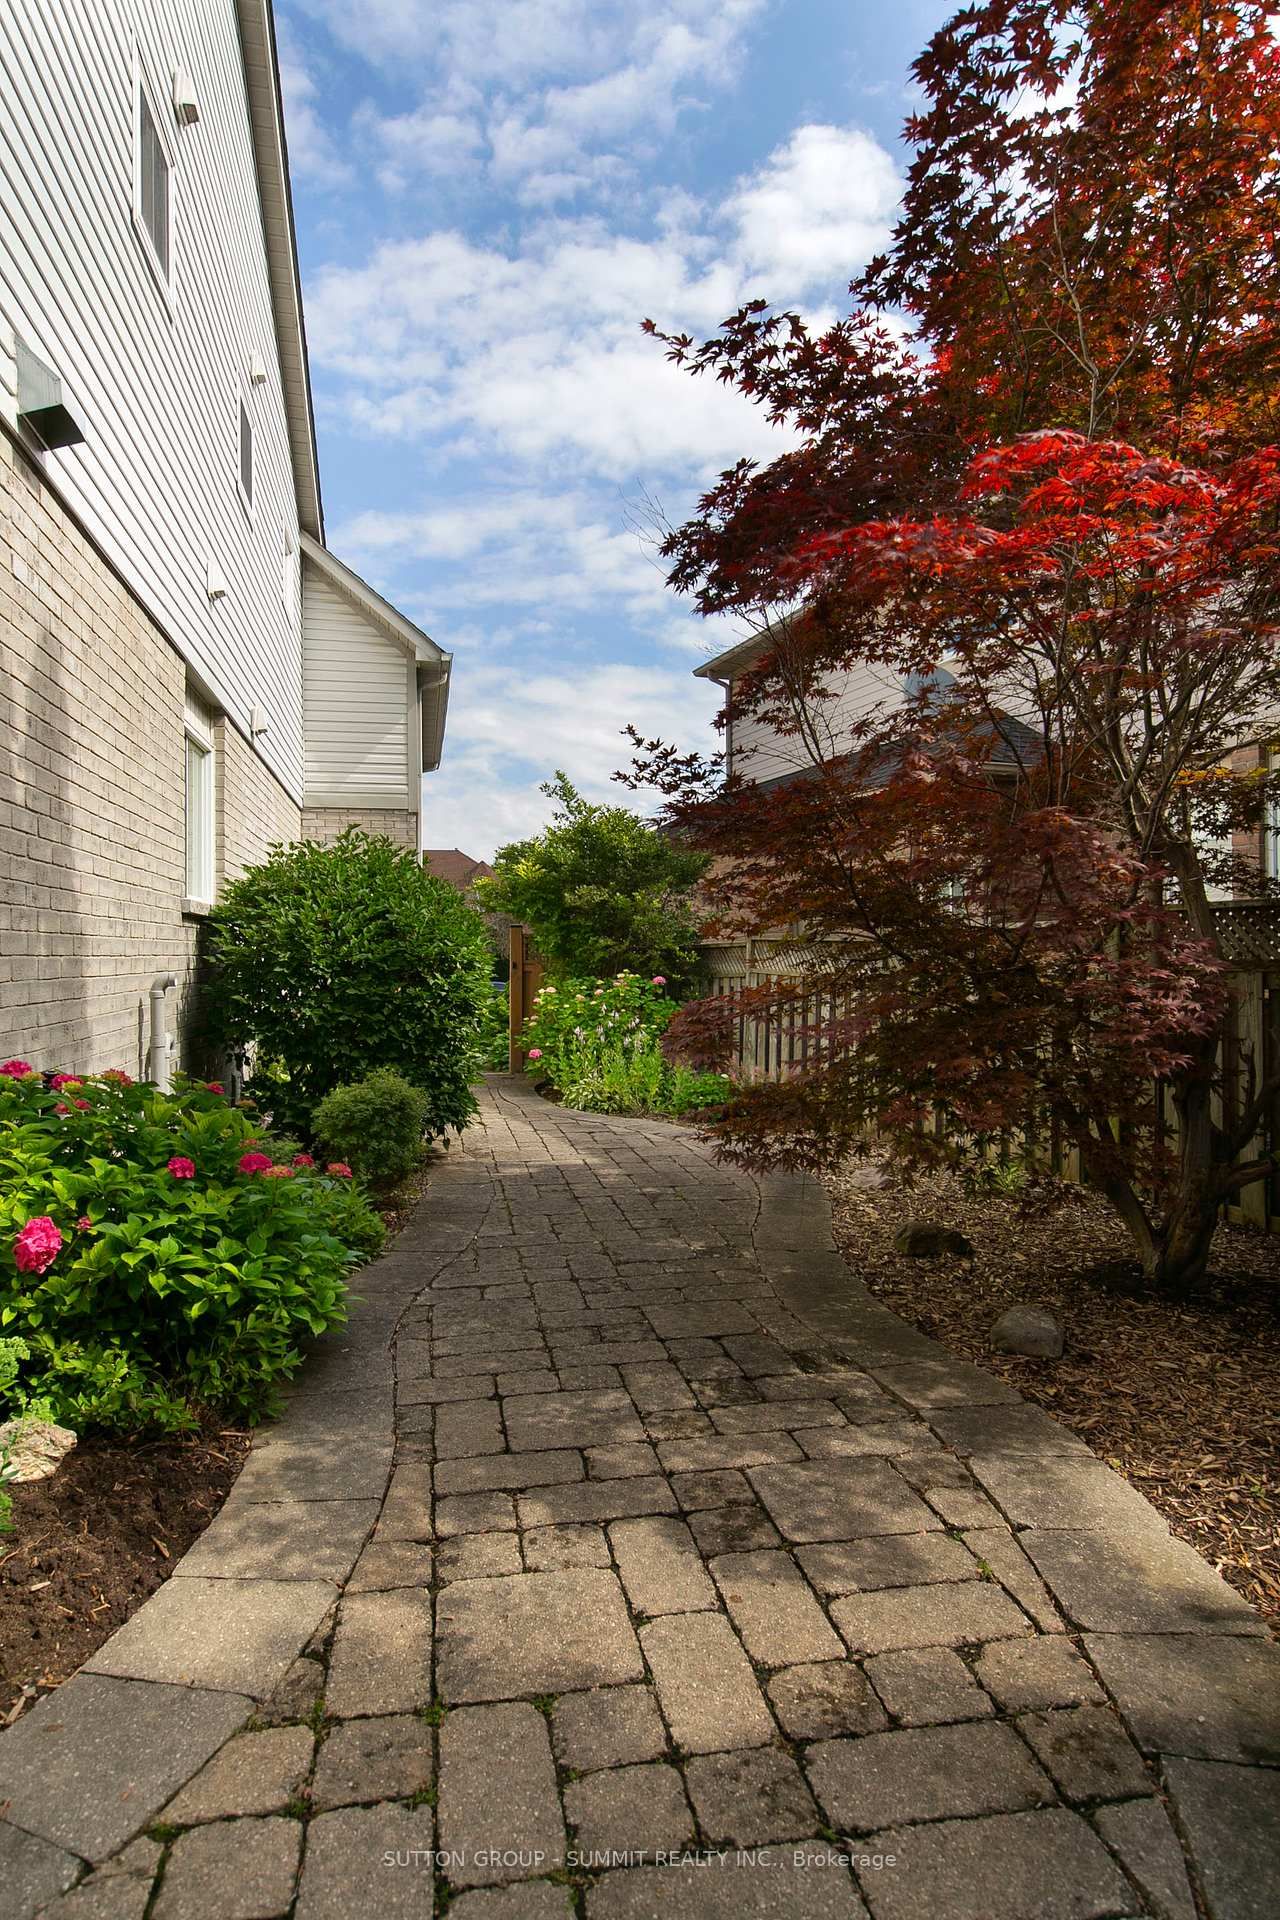
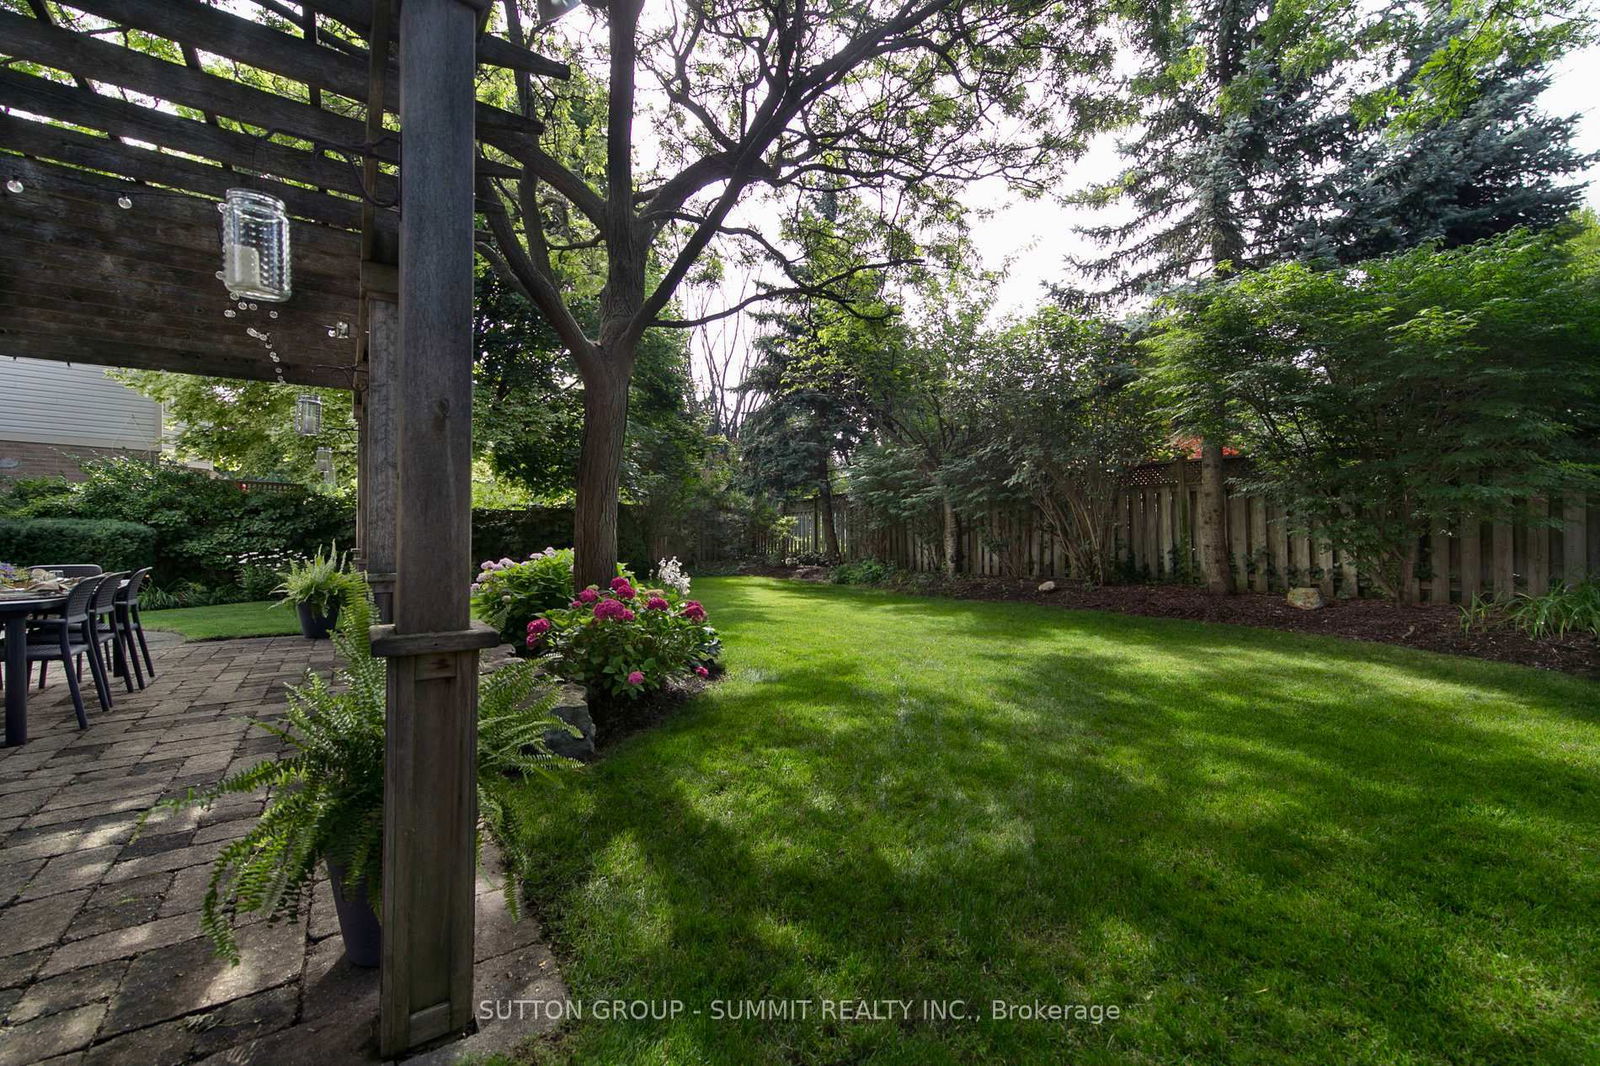
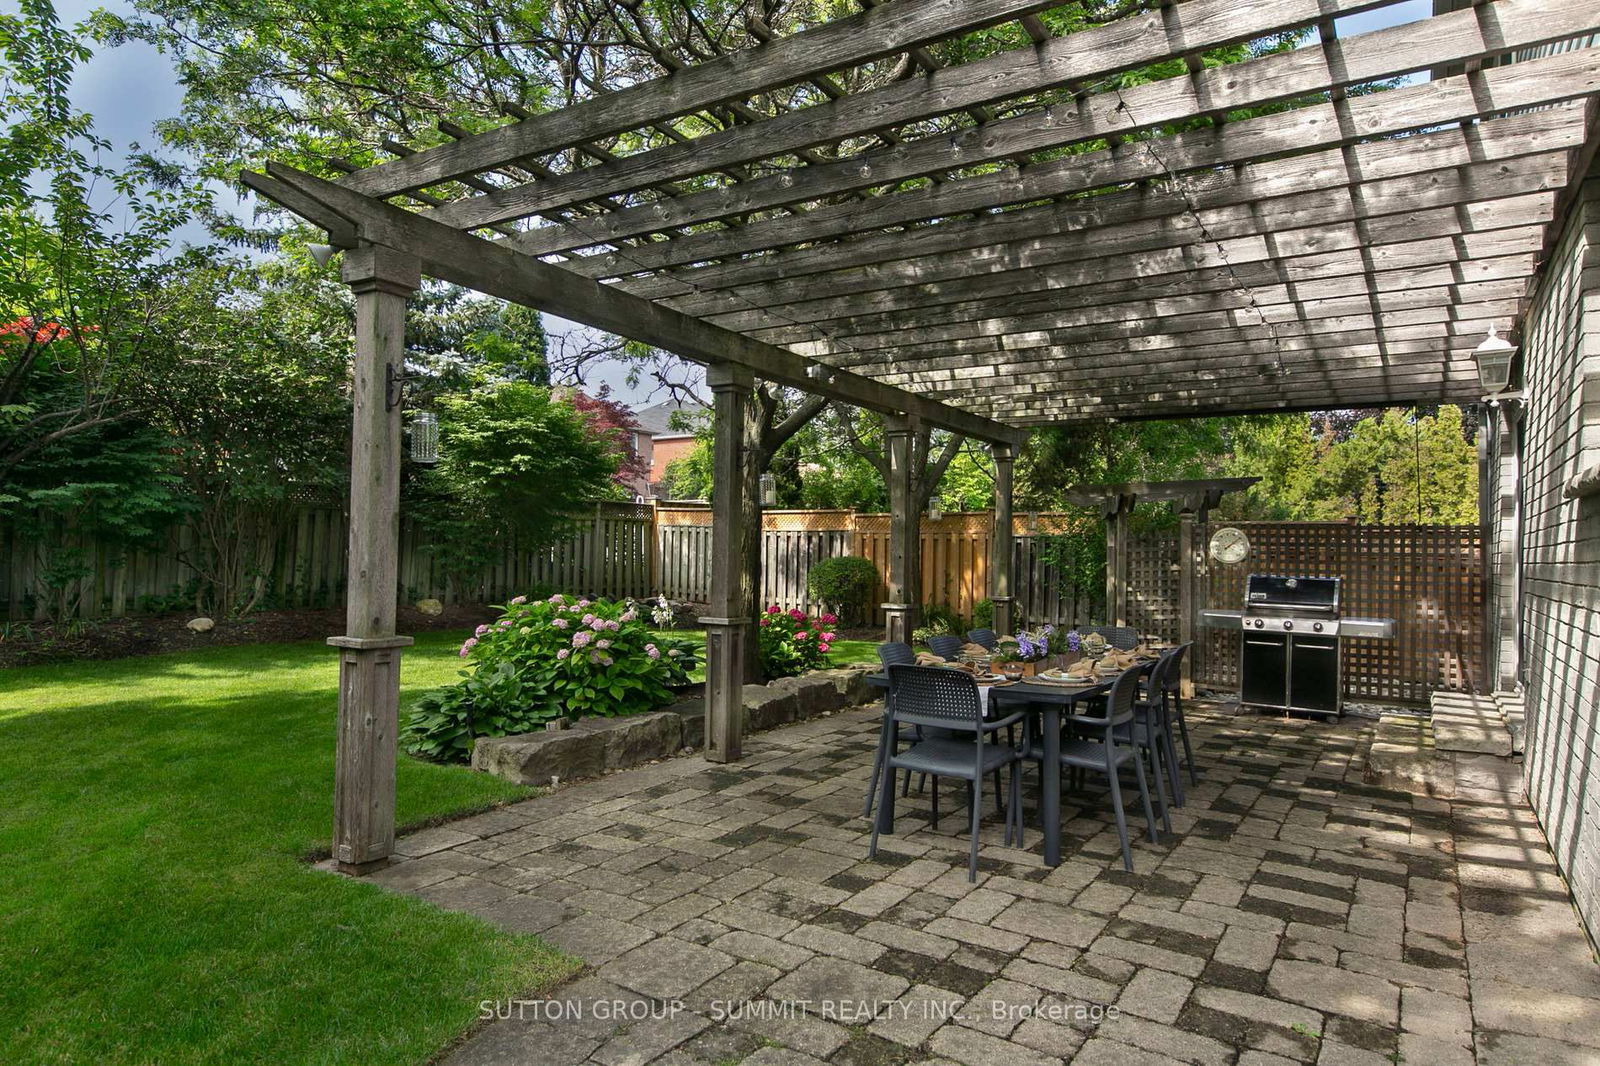
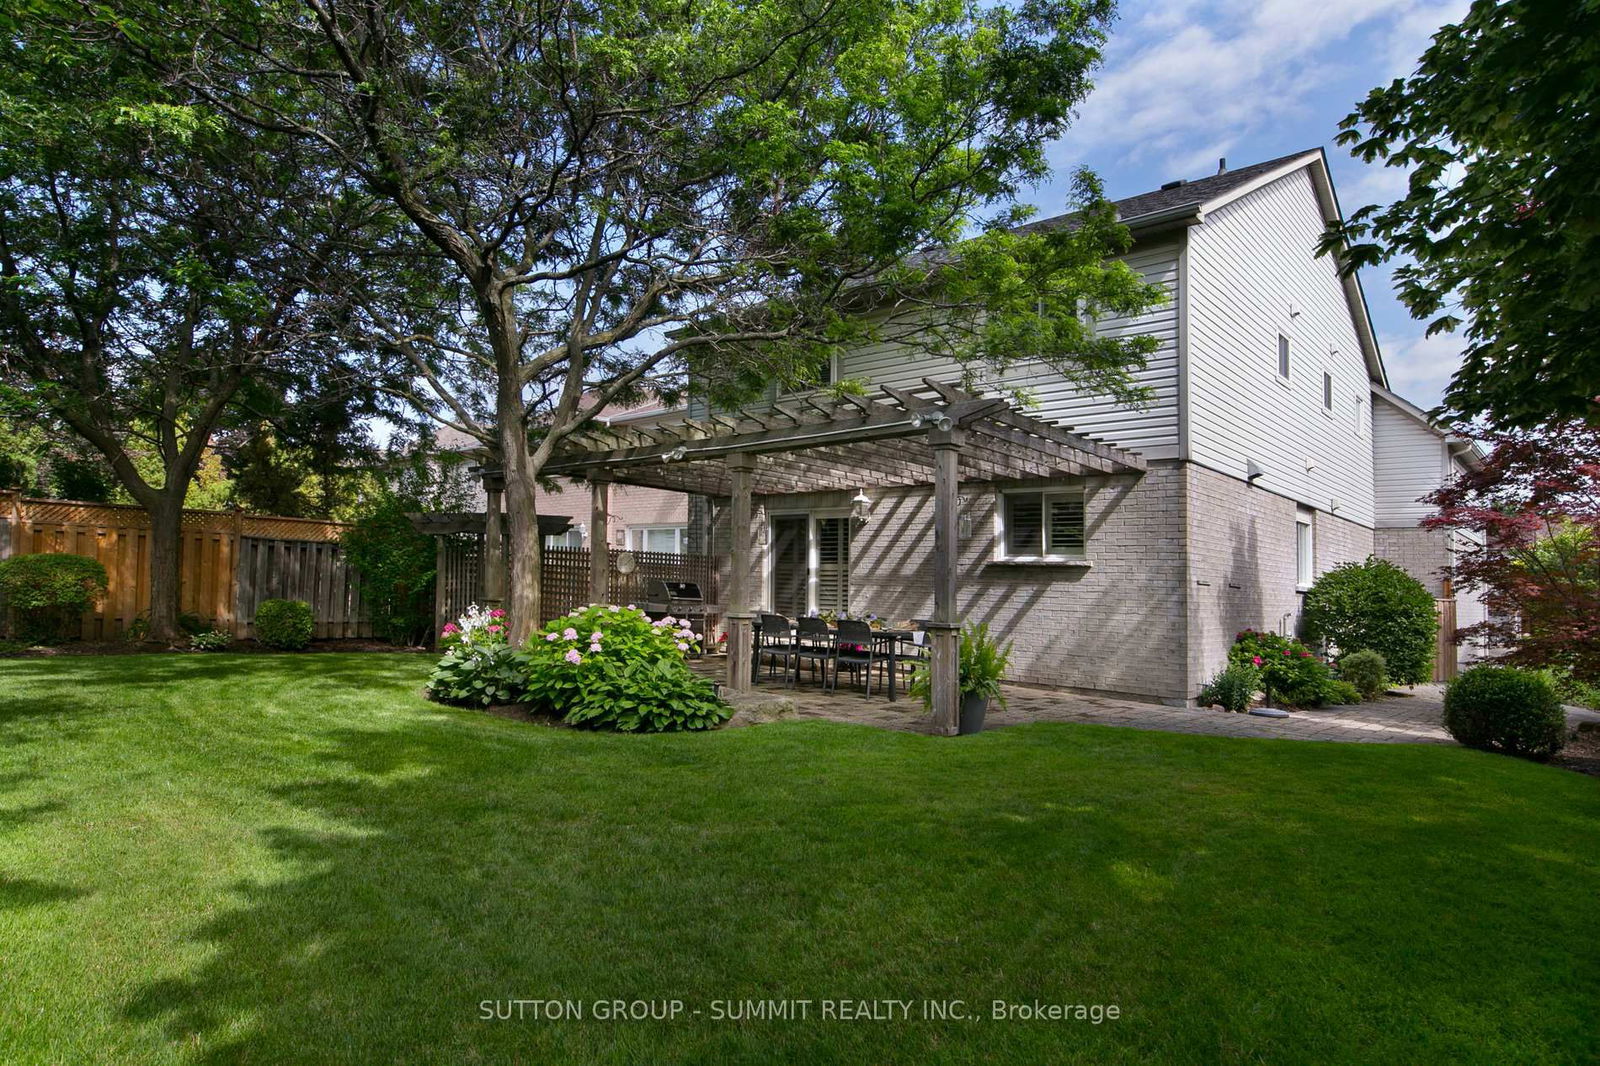
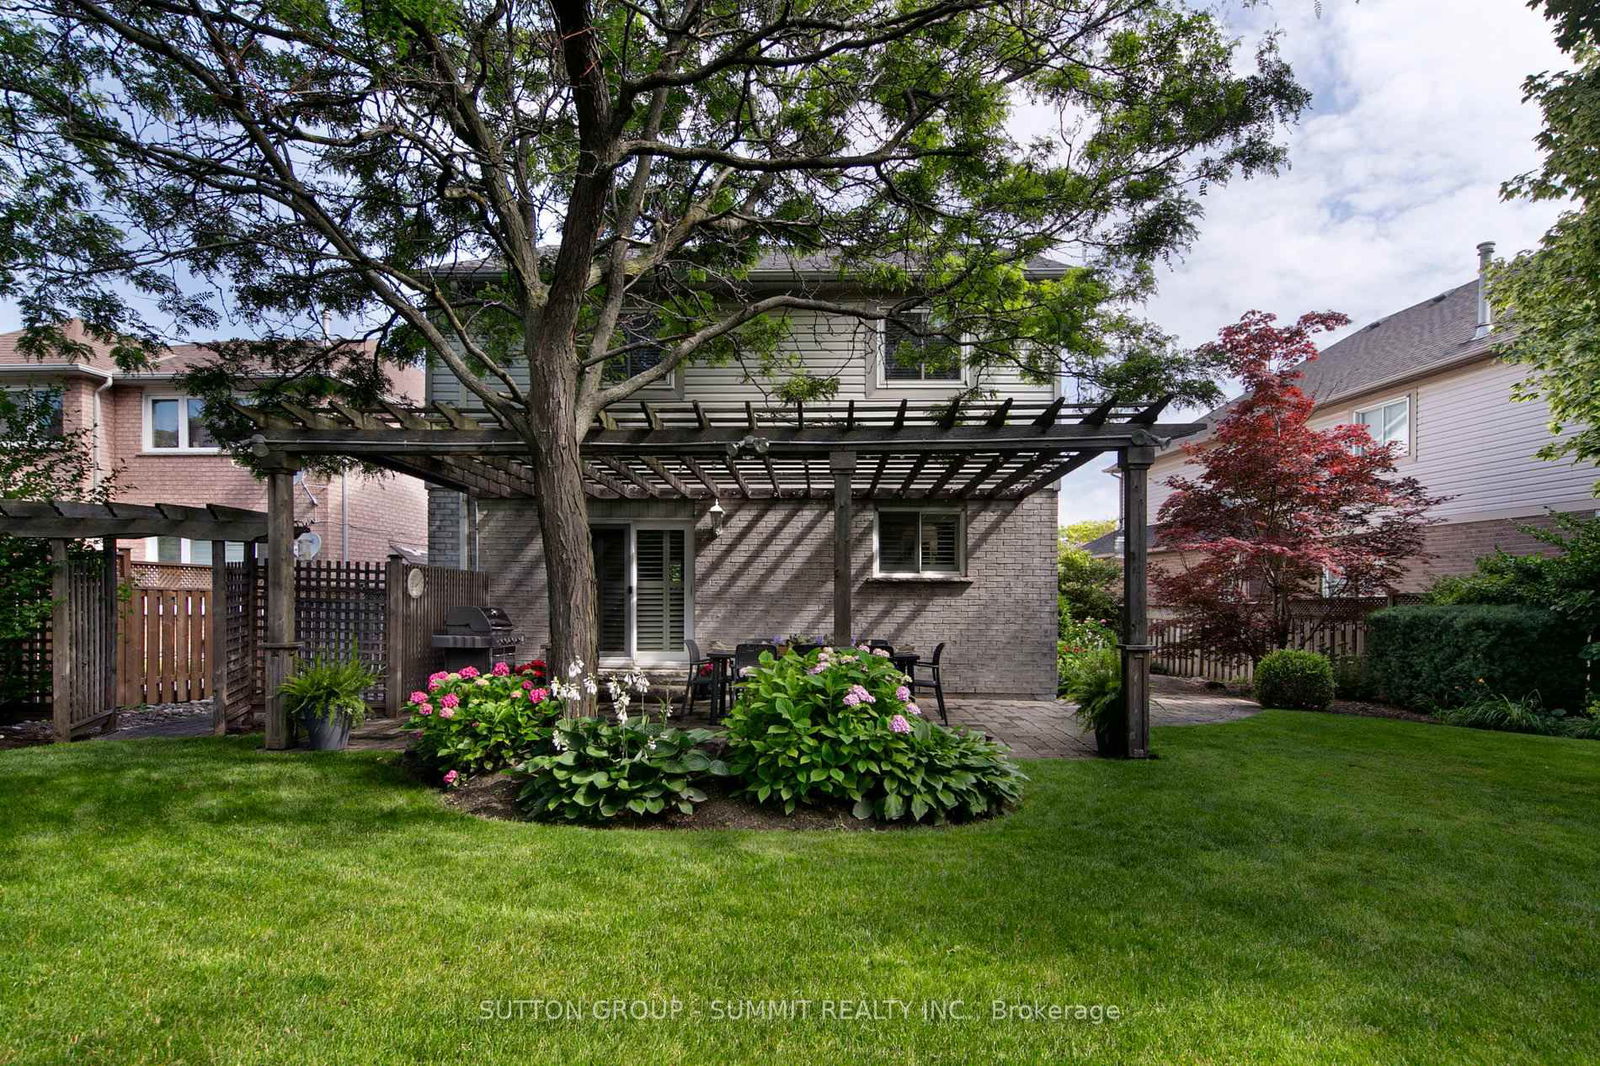
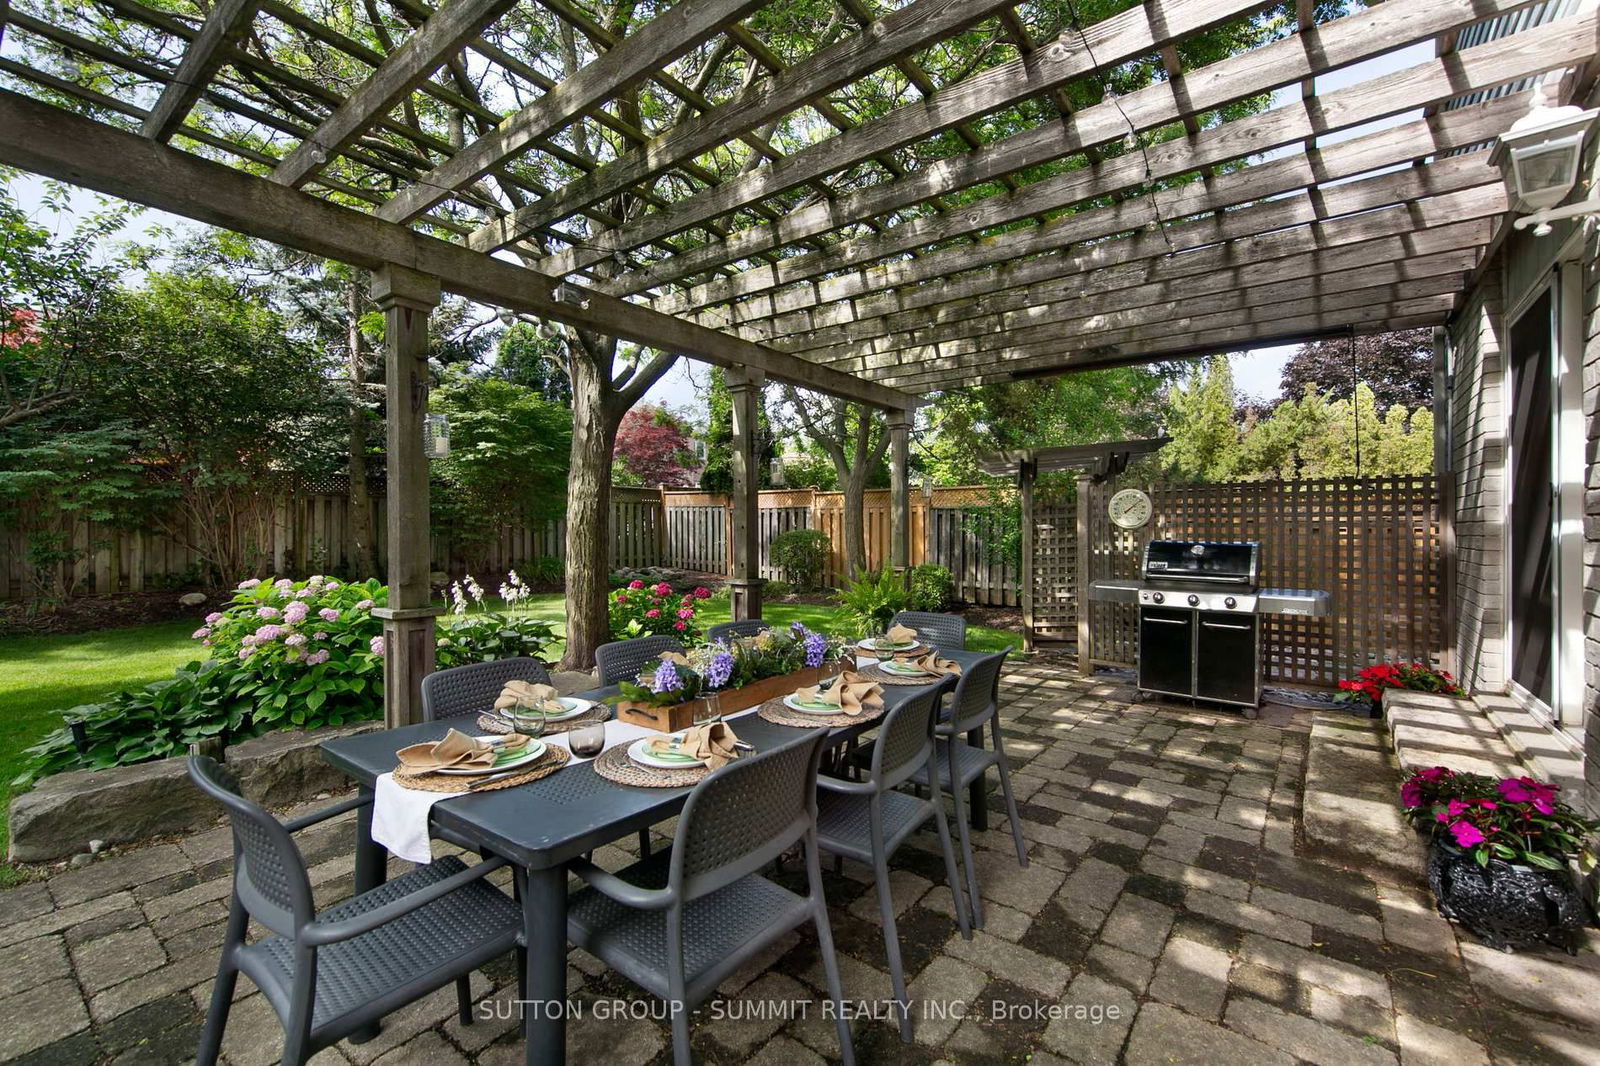
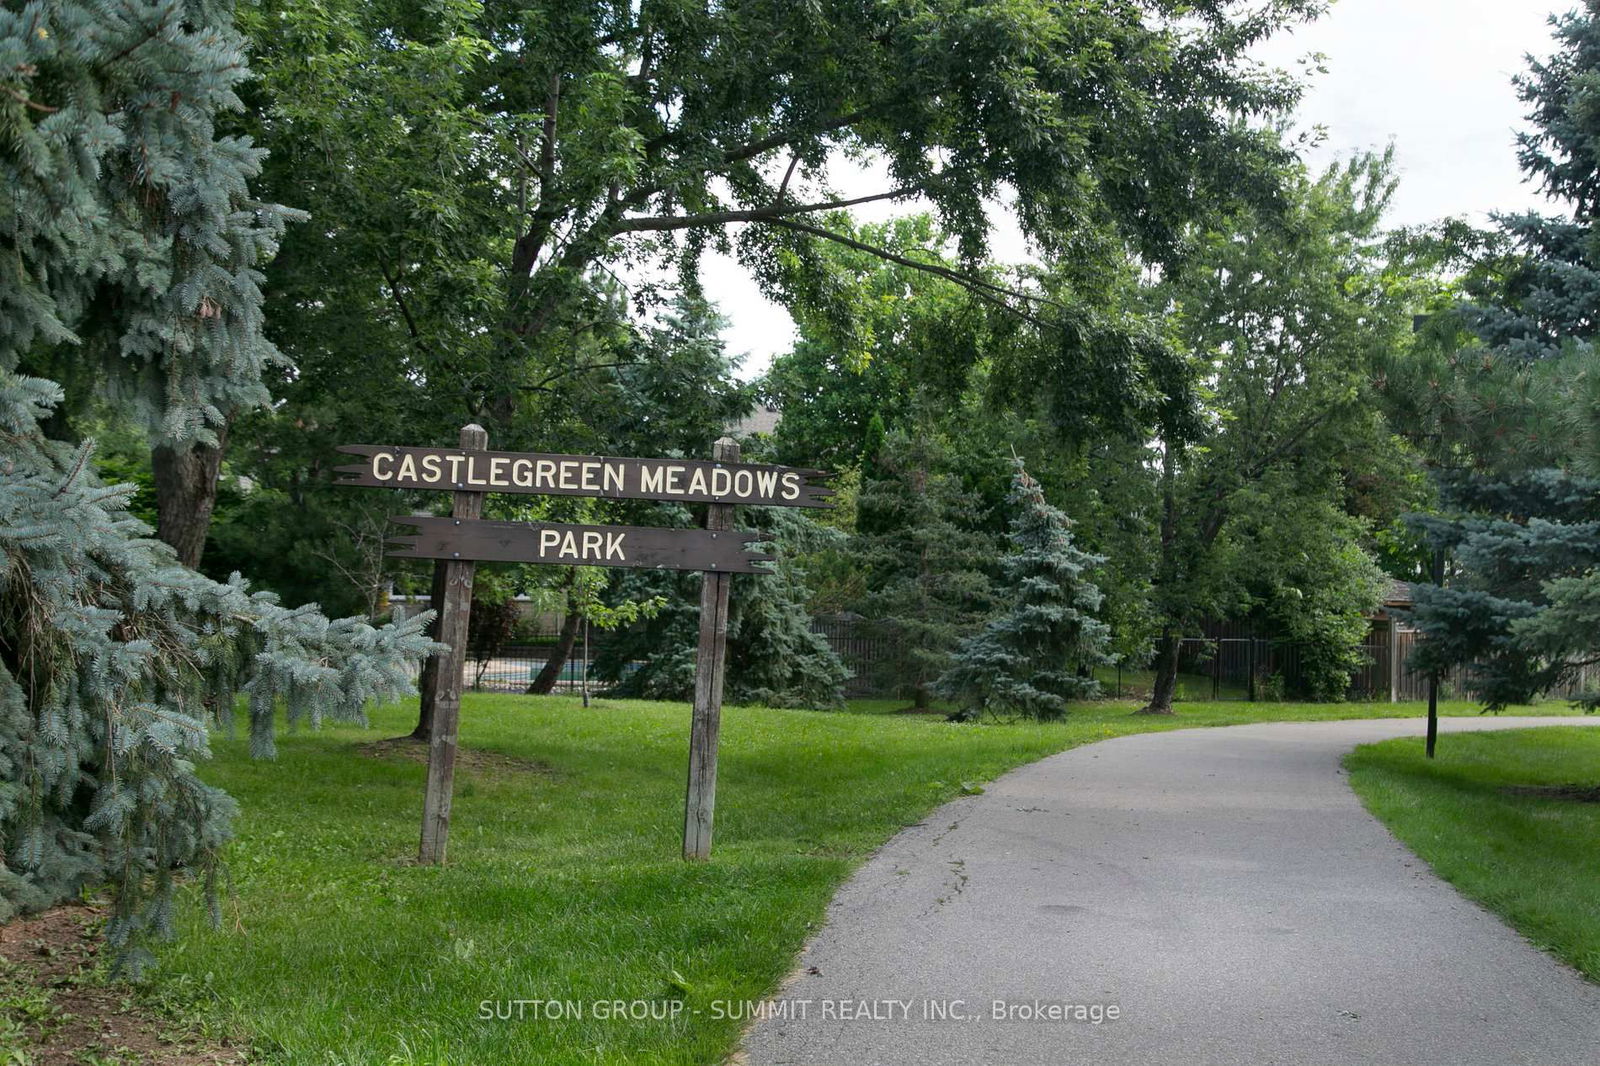
Stunning 4-Bedroom Family Home In Central Erin Mills! Nestled On A Quiet Tree-Lined Cul-De-Sac, This Beautifully Renovated Home Sits On A Premium Pie-Shaped Lot With Direct Park Access-Perfect For Families Who Love The Outdoors! With Over $350K In Renovations, This Home Offers Luxury And Comfort, Featuring: Gourmet Chef's Kitchen - Granite Countertops, Built-In Appliances, A Workstation And An Open-Concept Design That Flows Seamlessly Into The Sun-Filled Great Room, perfect For Entertaining or Relaxing. Spa-Like Primary Retreat - Spacious Primary Suite With Newly Renovated Luxurious Ensuite And A Large Walk-In Closet. Elegant Finishes Throughout - Gleaming Hardwood Floor, All Bathrooms Renovated , And A Professionally Landscaped Backyard. Outdoor Oasis - A Gorgeous Stone Patio, Pergola, Twinkle Lights And Flood Lighting Create The Perfect Space For Summer Nights And Entertaining. Brand New Furnace And Air Conditioner. Located In The Top-Ranked School District - John Fraser & St. Aloysius Gonzaga (French Immersion). With Easy Access To Major Highways, Shopping, Parks & Recreation Centers. A Rare Opportunity To Own A Meticulously Updated Home In A Prime Location - Don't Miss Out!
All Built-In Stainless Steel Appliances, Fridge, Gas Stove Top, Built-In Microwave, Wall Oven, Wall Warming Oven, Washer/Dryer, All Electrical Light Fixtures, All Window Coverings, Electric Garage Door Opener & 2 Remotes, In-Ground Sprinkler System, Basement Fridge,Basement Chest Freezer, Surround Sound Speakers, Gas Weber BBQ, Backyard Gas Quick Connect Hook-Up, Electric Fireplace Cabinet. HRV/As-Is.
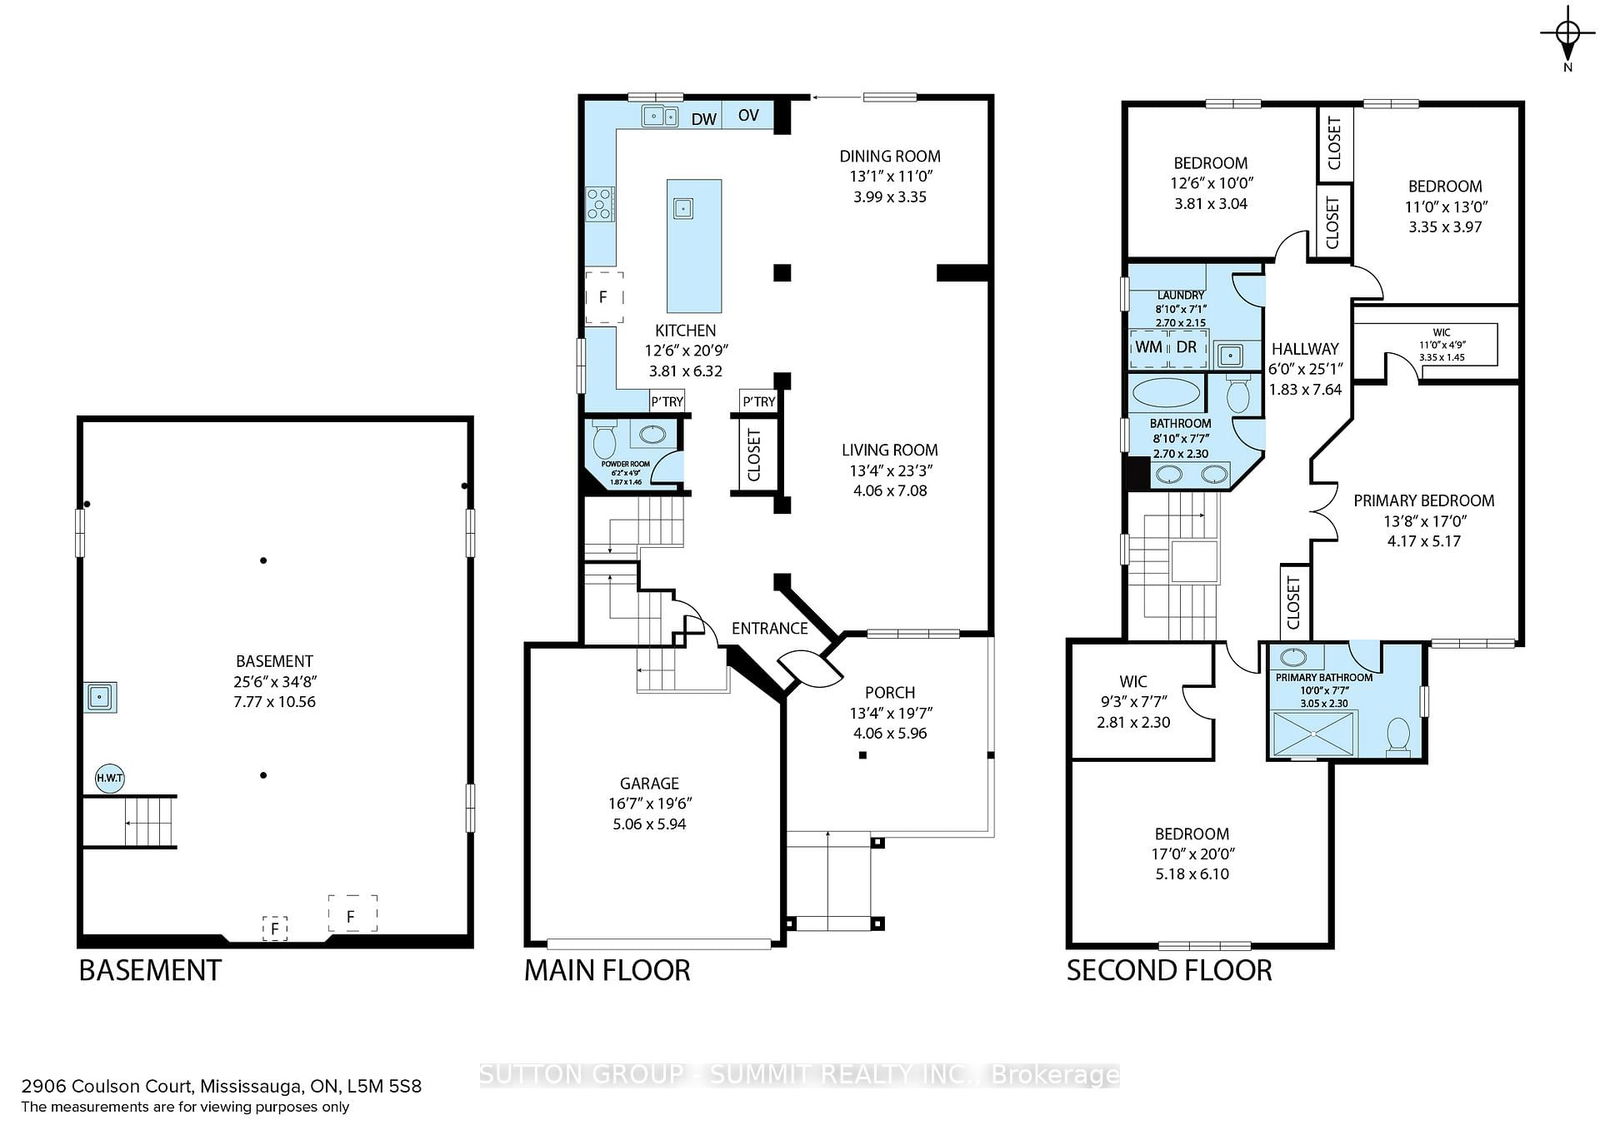
Kitchen
Dining
Living
Family
Primary
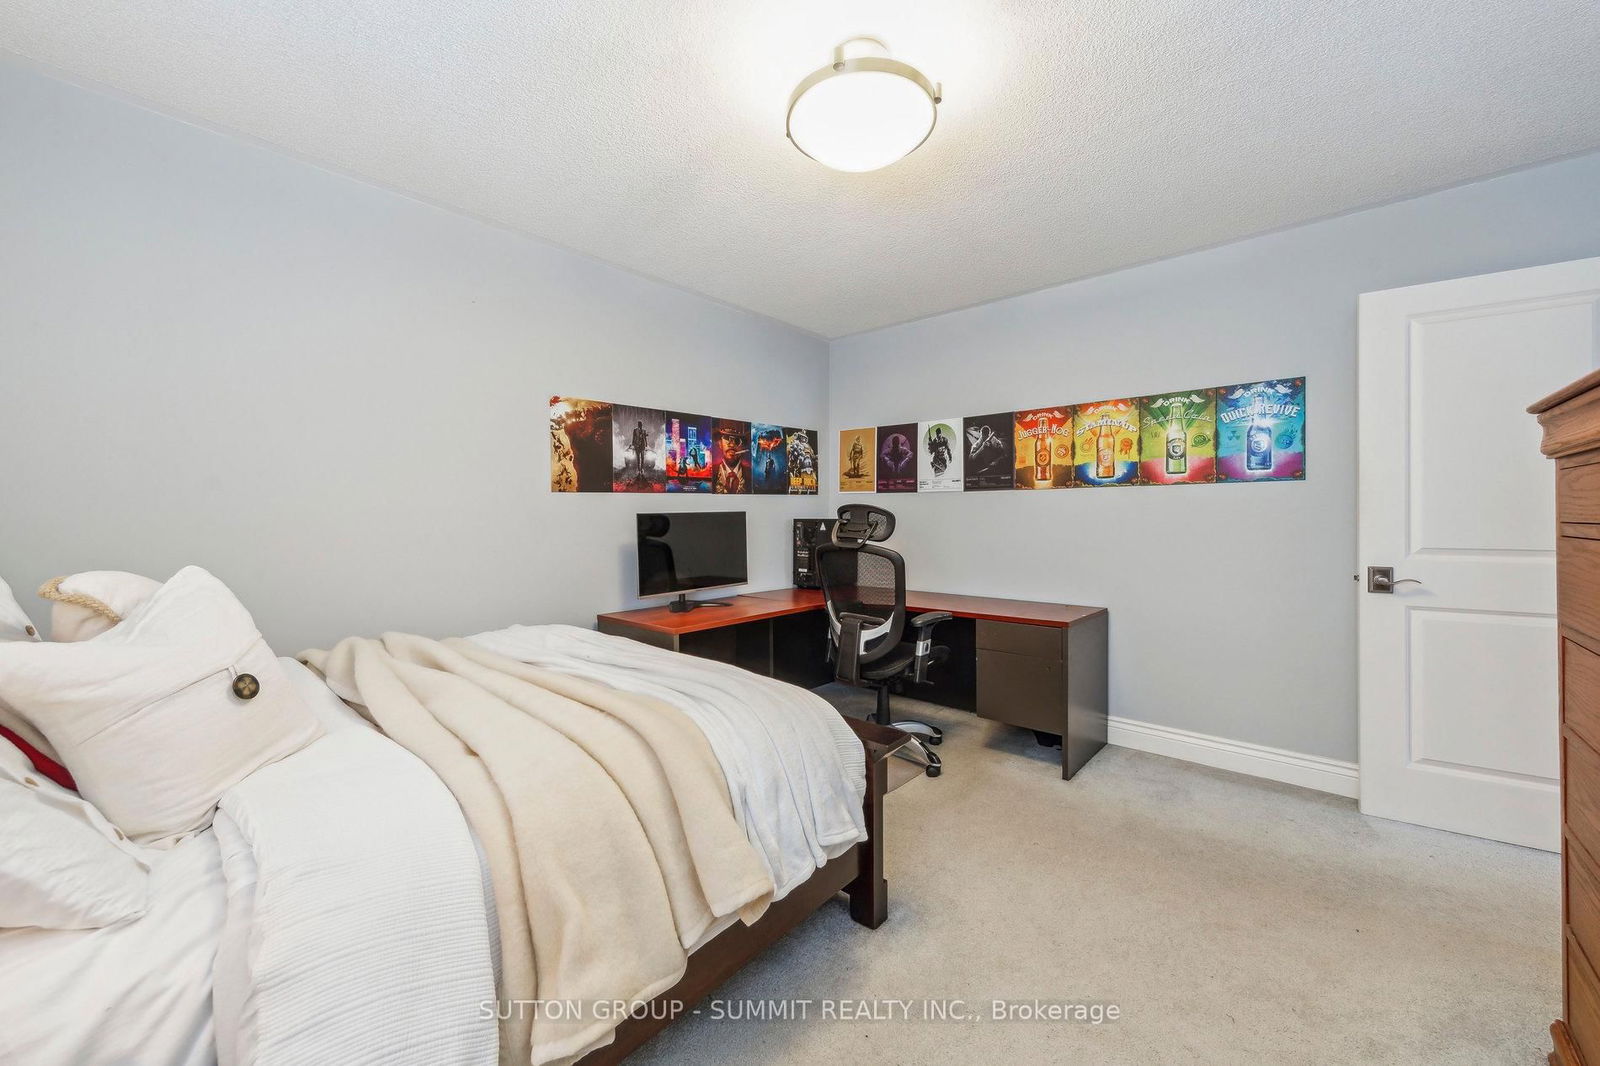
2nd Br
3rd Br
4th Br
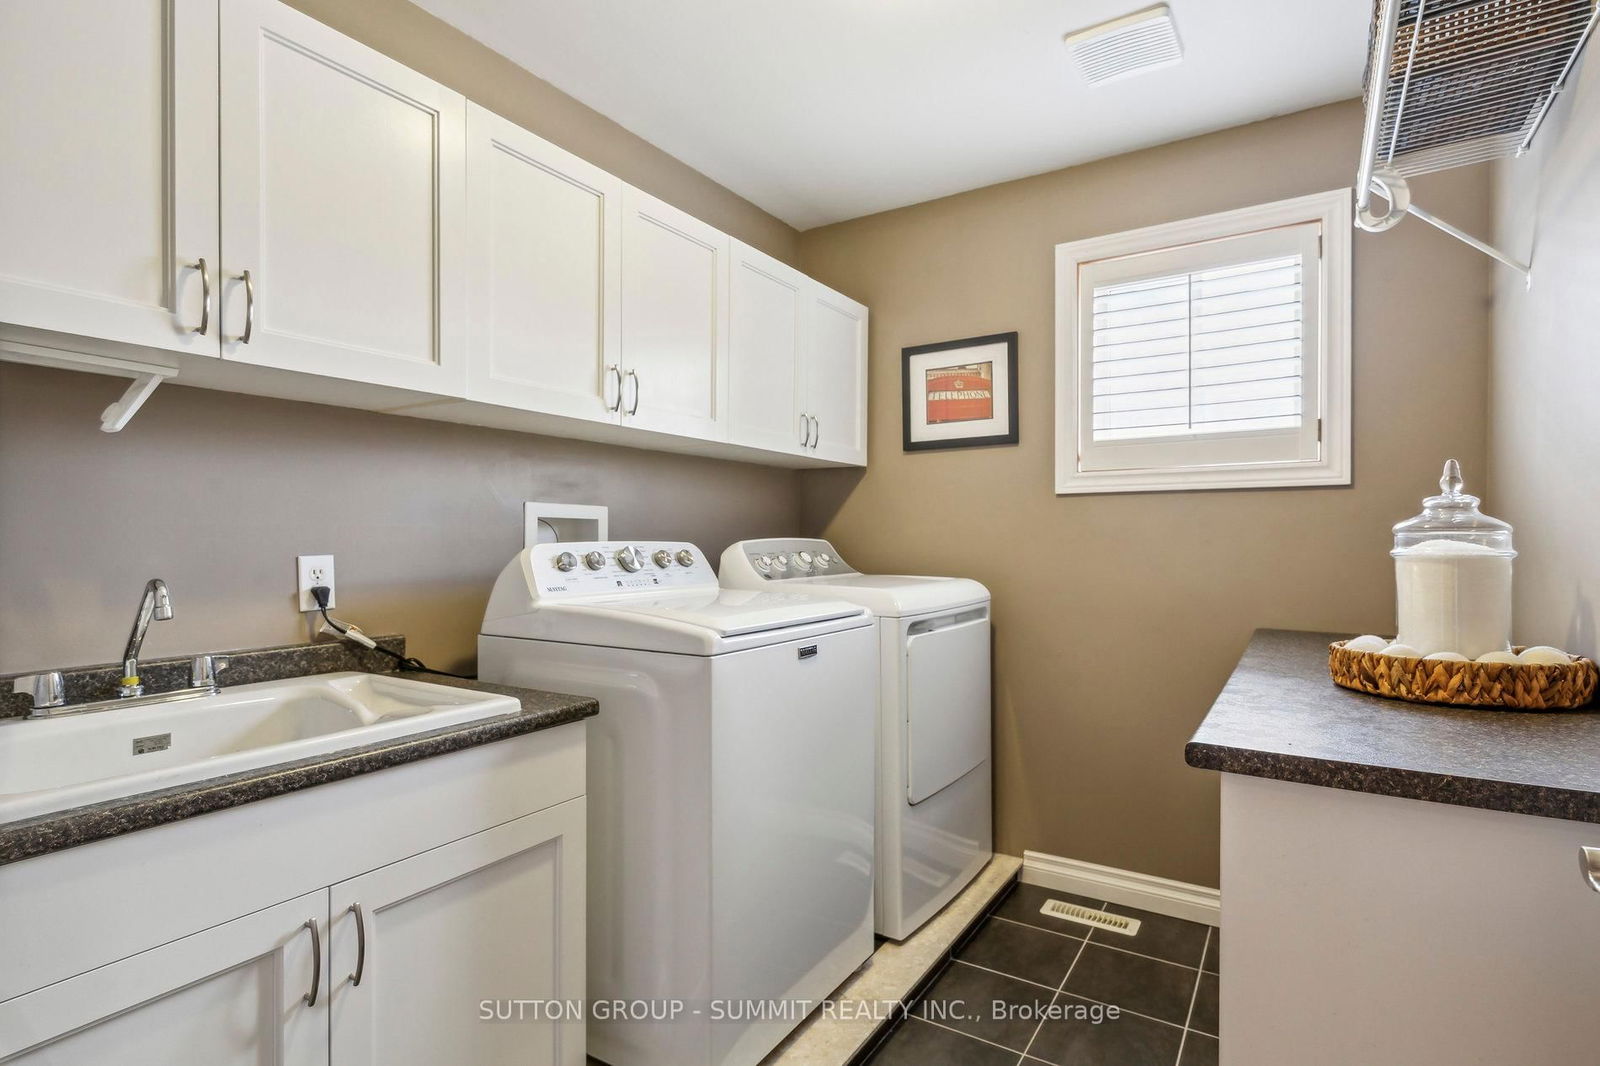
Laundry
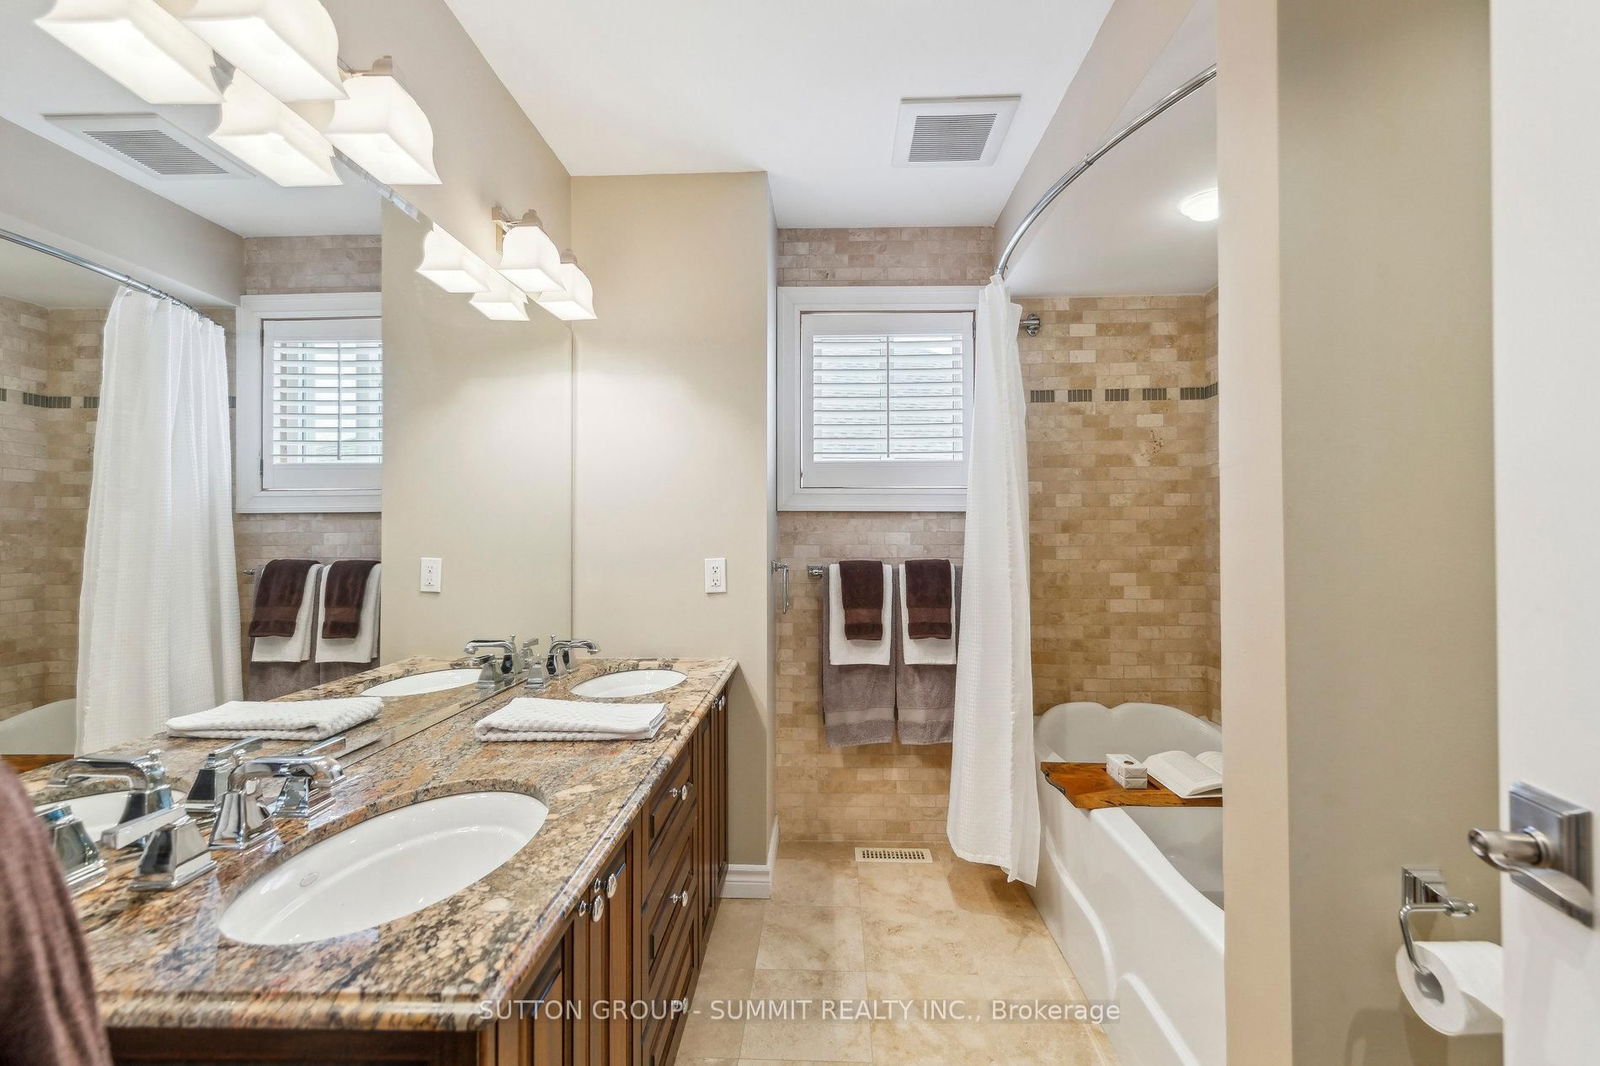
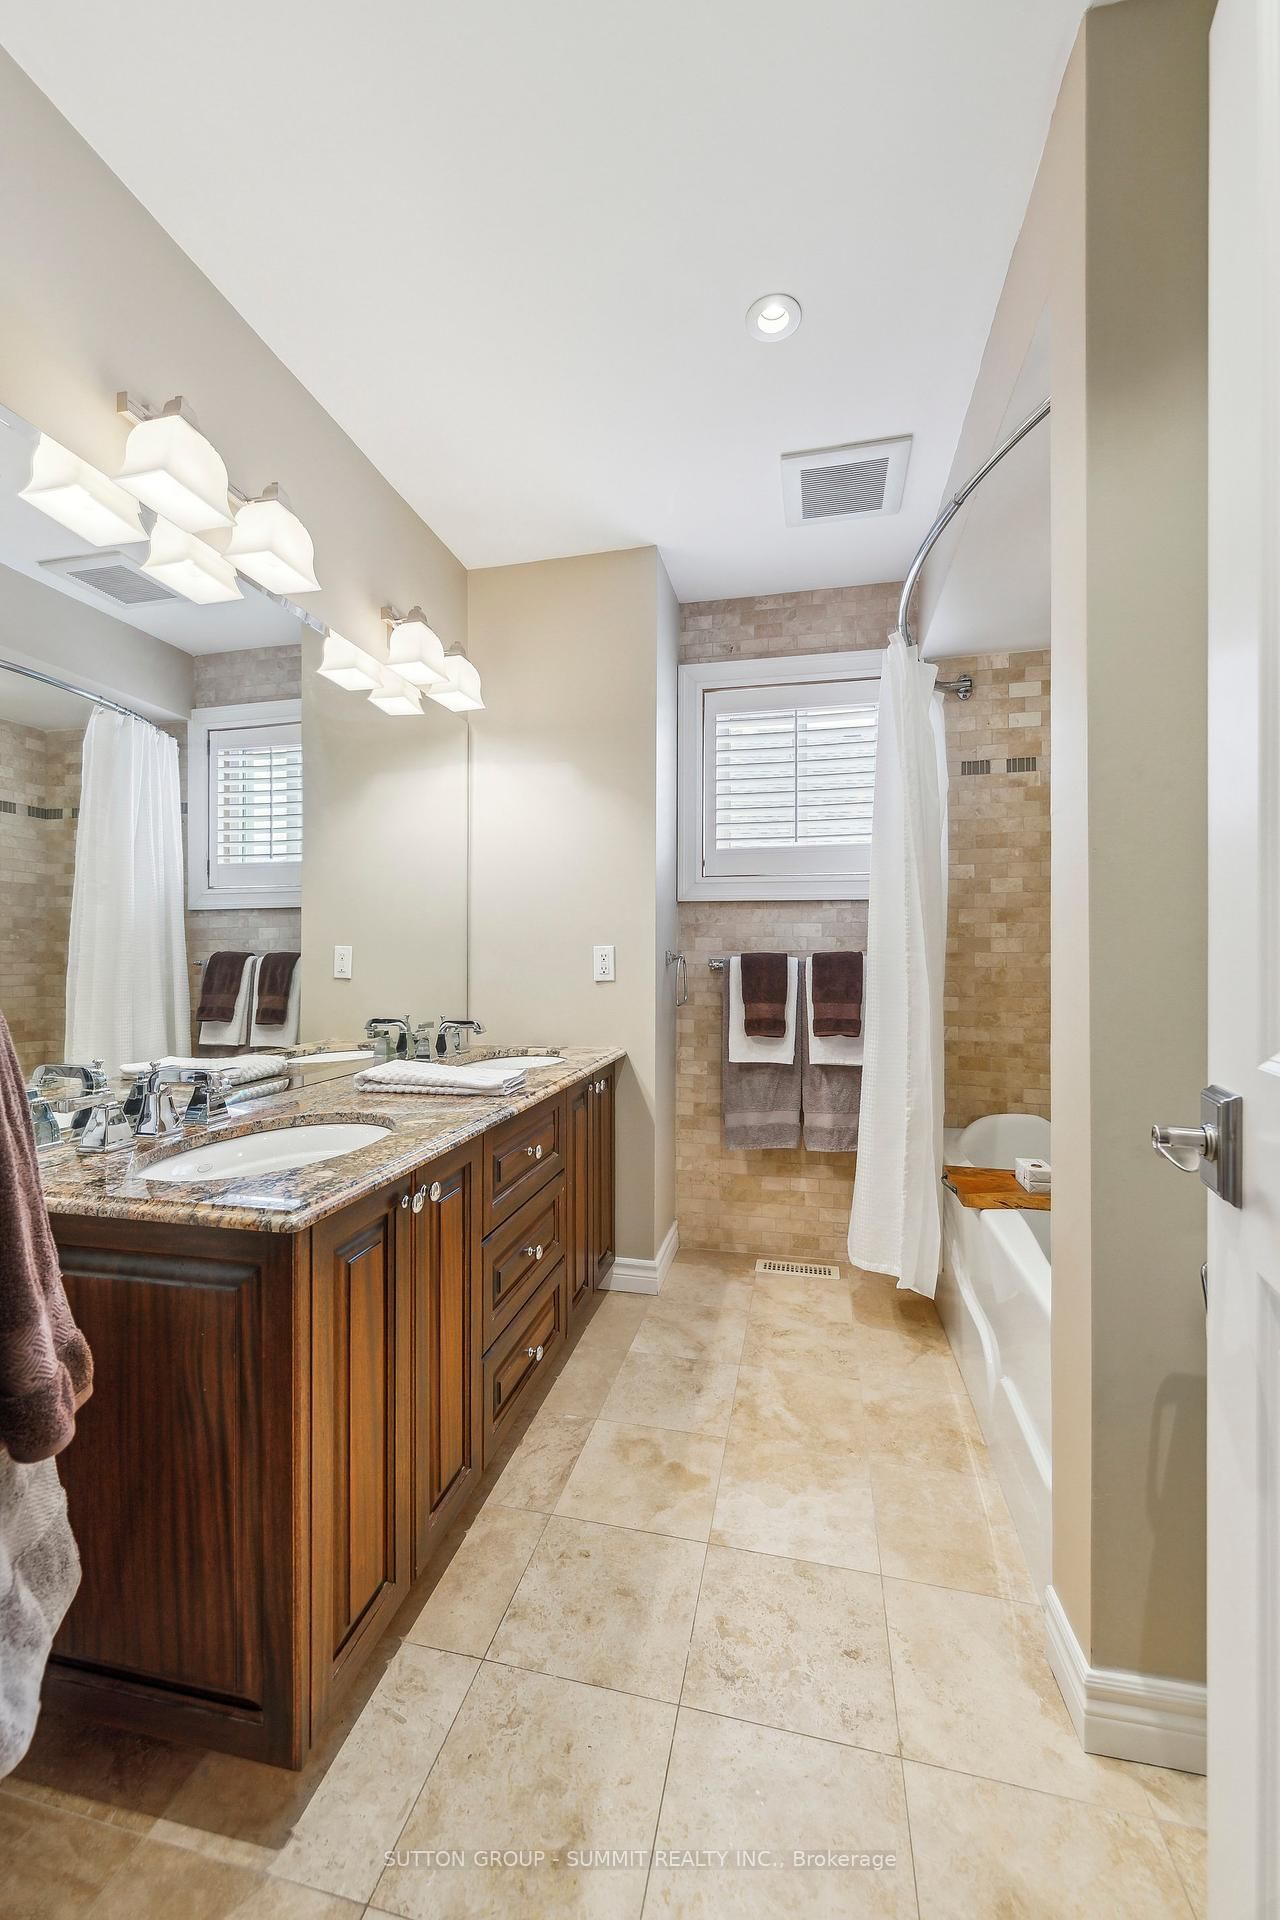
Bathroom
Bathroom
The graph below compares the average list price and average sale price of homes in this neighborhood by month for the last 24 months. When average sale price is greater than average list price, this may suggest a buyer's market. When average sale price is lower than the average list price this may suggest a seller's market.
The graph below illustrates the average days on market for homes in this neighborhood. The yellow area may indicate a buyer's market, the green area may indicate a balanced market and the red area may indicate a seller's market.
Sales Representative, Century 21 People’s Choice Realty Inc., Brokerage
(647) 576 - 2100
Mississauga, Central Erin Mills, L5M 5S2
Mississauga, Central Erin Mills, L5M 5E8
Mississauga, Central Erin Mills, L5M 5G6
Mississauga, Churchill Meadows, L5M 0H3
Mississauga, Central Erin Mills, L5M 5X9
Mississauga, Churchill Meadows, L5M 7B2